empty
25.10.2021 01:00 PM
Technical analysis recommendations of EUR/USD and GBP/USD on October 25

EUR/USD

This image is no longer relevant

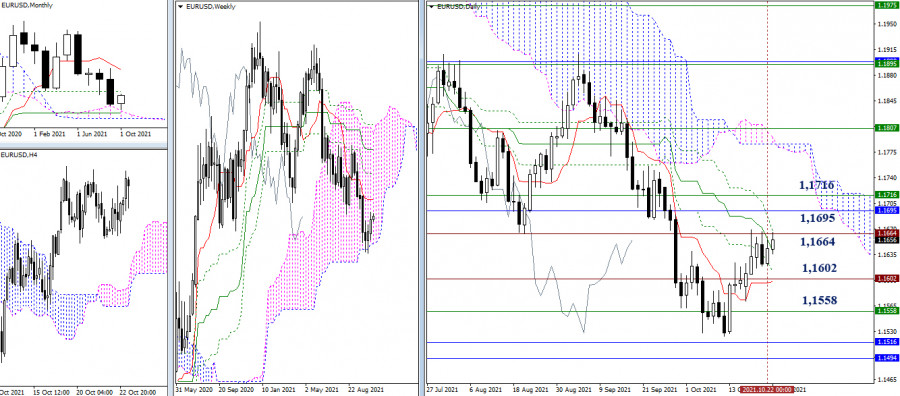
The slowdown below the historical resistance of 1.1664 remains. The final level of the Ichimoku daily dead cross (1.1667) has fallen into this area today. As a result, the breakdown of resistance will eliminate the bearish cross and help the bulls to strengthen their positions. The next upward targets are still at 1.1695 (monthly Fibo Kijun) and 1.1716 (weekly Tenkan). But in the case of bearish activity, the nearest support level of 1.1602 (historical level + daily levels) will be considered. The next interests can be directed to interacting with the level of 1.1558 (lower border of the weekly cloud) and 1.1516 - 1.1494 (monthly levels).

This image is no longer relevant

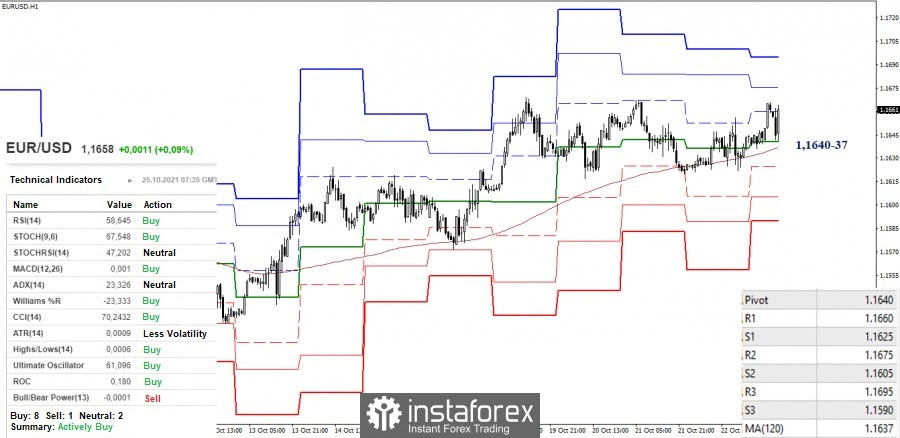
The pair continues to remain in the zone of the downward correction in the smaller timeframes. For a long time, the key support levels are being tested. They are joining forces in the area of 1.1640-37 today. A breakdown, consolidation below, and a reversal of moving averages will change the current balance of power in favor of the bears. The support for the classic pivot levels 1.1625 - 1.1605 - 1.1590 will serve as the intraday downward pivot points.

As for the bulls, the main task is to restore the upward trend (1.1669). The next upward pivot points can be 1.1675 (R2) and 1.1695 (R3), these resistances are being strengthened from the higher timeframes.

GBP/USD

This image is no longer relevant

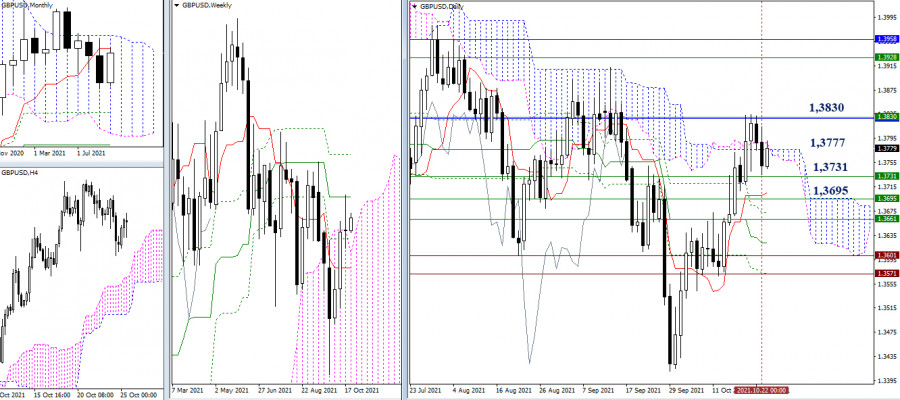
The bulls could not hold their positions below the encountered resistance level of 1.3830 (monthly short-term trend + weekly medium-term trend) during last week's closing. Currently, the attraction zone continues to provide a daily cloud (1.3777). The nearest support levels are set sequentially with some distance from each other – 1.3731 - 1.3695 - 1.3661 (daily and weekly levels).

This image is no longer relevant

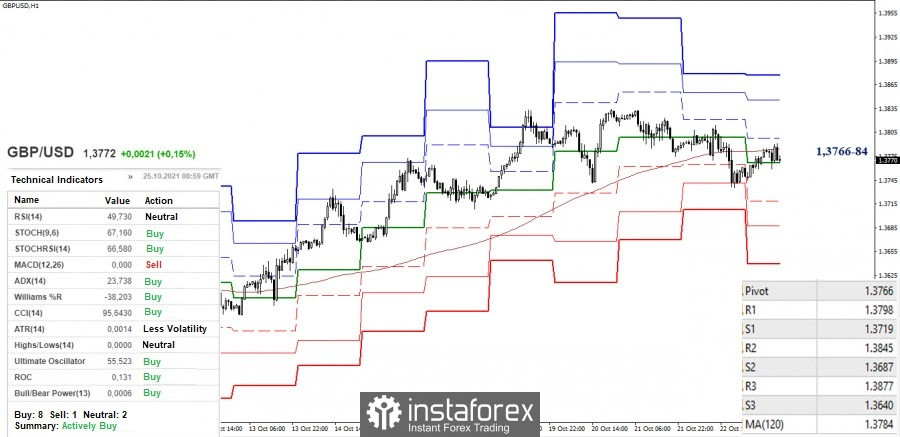
There is a struggle to reach the key levels in the smaller timeframes, which are uniting in the area of 1.3766-84 (central pivot level + weekly long-term trend). The continuation of the decline after the update of the low (1.3735) will open the way to the supports of the classic pivot levels (1.3719 - 1.3687 - 1.3640). On the contrary, a consolidation above the range of 1.3766-84 will set the task to recover the upward trend (1.3834). The resistances of the classic pivot levels 1.3845 and 1.3877 can be the additional upward pivot points within the day.

***

Ichimoku Kinko Hyo (9.26.52) and Kijun-sen levels in the higher time frames, as well as classic Pivot Points and Moving Average (120) on the H1 chart, are used in the technical analysis of the trading instruments.

Evangelos Poulakis,
الخبير التحليلي لدى شركة إنستافوركس
© 2007-2025
حدد الإطار الزمني
5
د
15
د
30
د
1
س
4
ساعات
1
يوم
1
أسبوع
كسب عائد من تغيرات أسعار العملات المشفرة مع إنستافوركس.
قم بتحميل منصة التداول ميتاتريدر 4 وافتح أول صفقة.
  • Grand Choice
    Contest by
    InstaForex
    InstaForex always strives to help you
    fulfill your biggest dreams.
    انضم إلى المسابقة

المقالات الموصى بها

إشارات التداول لليورو/الدولار الأمريكي للفترة من 5 إلى 8 مايو 2025: بيع تحت 1.1370 (200 EMA - 6/8 Murray)

في بداية الجلسة الأمريكية، يتداول زوج اليورو/الدولار الأمريكي حول مستوى 1.1345، ليصل إلى قمة قناة الاتجاه الهابط ويظهر علامات على الإرهاق. يمكن لليورو أن يستأنف دورته الهبوطية إذا استقر

Dimitrios Zappas 17:34 2025-05-05 UTC+2

إشارات التداول للذهب (XAU/USD) للفترة من 5 إلى 8 مايو 2025: الشراء فوق $3,305 (21 SMA - 7/8 Murray)

من ناحية أخرى، قد يؤدي ضعف المعدن تحت المتوسط المتحرك البسيط لـ 21 يومًا عند 3,280 إلى استئناف الدورة الهبوطية. لذا، يمكننا توقع وصول الذهب إلى قاع قناة الاتجاه الهابط

Dimitrios Zappas 17:31 2025-05-05 UTC+2

اليورو/الدولار الأمريكي. نتائج اجتماع الفيدرالي قد تؤدي إلى تراجع الزوج

يتحرك الزوج في نطاق ضيق تحت مستوى المقاومة 1.1345 في انتظار نتائج اجتماع السياسة النقدية للاحتياطي الفيدرالي، والذي سيختتم يوم الأربعاء، 7 مايو. إذا قرر الاحتياطي الفيدرالي الإبقاء

Pati Gani 10:59 2025-05-05 UTC+2

اليورو/الدولار الأمريكي – 5 مايو: سوق العمل الأمريكي ليس ميؤوسًا منه

يوم الجمعة، ارتفع زوج اليورو/الدولار الأمريكي إلى مستوى 1.1374، ثم ارتد وعكس الاتجاه لصالح الدولار الأمريكي. هاجم الدببة مرة أخرى، ولكن لفترة وجيزة فقط، وبشكل عام ظلوا ضعفاء

Samir Klishi 10:57 2025-05-05 UTC+2

GBP/USD – 5 مايو: ترامب قد يرفع التعريفات الجمركية على الصين

على الرسم البياني الساعي، واصل زوج الجنيه الإسترليني/الدولار الأمريكي تراجعه يوم الجمعة نحو مستوى تصحيح فيبوناتشي 161.8% عند 1.3249. الارتداد من هذا المستوى سيفضل الجنيه الإسترليني وقد يؤدي

Samir Klishi 10:51 2025-05-05 UTC+2

توقعات الفوركس 05/05/2025: اليورو/الدولار الأمريكي، الجنيه الإسترليني/الدولار الأمريكي، الدولار الأمريكي/الين الياباني، الدولار الأمريكي/الفرنك السويسري، الدولار الأمريكي/الدولار الكندي وبيتكوين

روابط مفيدة: مقالاتي الأخرى متوفرة في هذا القسم دورة InstaForex للمبتدئين التحليلات الشائعة افتح حساب تداول مهم: يجب على المبتدئين في تداول الفوركس أن يكونوا حذرين للغاية عند اتخاذ القرارات

Sebastian Seliga 10:23 2025-05-05 UTC+2

التحليل الفني لحركة السعر اللحظية لأداة سلعة الذهب، الاثنين 5 مايو 2025.

مع ظهور نمط الوتد الهابط على الرسم البياني لمدة 4 ساعات، فإنه يعطي إشارة إلى أنه في المستقبل القريب لديه القدرة على الوصول إلى مستوى 3297.43 وإذا دعمت الزخم والتقلبات

Arief Makmur 08:23 2025-05-05 UTC+2

التحليل الفني لحركة السعر اللحظية لأزواج العملات المتقاطعة EUR/JPY، الاثنين 5 مايو 2025.

من خلال النظر إلى الرسم البياني لمدة 4 ساعات لزوج العملات المتقاطع EUR/JPY، يبدو أن هناك إمكانية لتعزيز EUR/JPY في المستقبل القريب، وهو ما تؤكده ظهور نمط التقارب بين حركة

Arief Makmur 08:23 2025-05-05 UTC+2

التحليل الفني لحركة السعر اللحظية لمؤشر ناسداك 100، الجمعة 2 مايو 2025.

من خلال ما يظهر على الرسم البياني لمدة 4 ساعات لمؤشر Nasdaq 100، فإن مؤشر Stochastic Oscillator في حالة تقاطع بيع وظهور نمط Rising Wedge، وبناءً على هذين الشرطين،

Arief Makmur 08:04 2025-05-02 UTC+2

إشارات التداول للذهب (XAU/USD) للفترة من 1 إلى 3 مايو 2025: الشراء فوق 3,203 دولار (200 EMA - 5/8 Murray)

من المحتمل أن يتداول سعر المعدن الأصفر بين 3,203 وقد يصل إلى قاع القناة الهابطة حول 3,181 في الأيام القادمة، وهو مستوى يتزامن مع المتوسط المتحرك الأسي 200 عند 3,173

Dimitrios Zappas 17:49 2025-05-01 UTC+2
لا تستطيع التحدث الآن؟
اطرح سؤالك في الدردشة.
Widget callback
 

Dear visitor,

Your IP address shows that you are currently located in the USA. If you are a resident of the United States, you are prohibited from using the services of InstaFintech Group including online trading, online transfers, deposit/withdrawal of funds, etc.

If you think you are seeing this message by mistake and your location is not the US, kindly proceed to the website. Otherwise, you must leave the website in order to comply with government restrictions.

Why does your IP address show your location as the USA?

  • - you are using a VPN provided by a hosting company based in the United States;
  • - your IP does not have proper WHOIS records;
  • - an error occurred in the WHOIS geolocation database.

Please confirm whether you are a US resident or not by clicking the relevant button below. If you choose the wrong option, being a US resident, you will not be able to open an account with InstaForex anyway.

We are sorry for any inconvenience caused by this message.