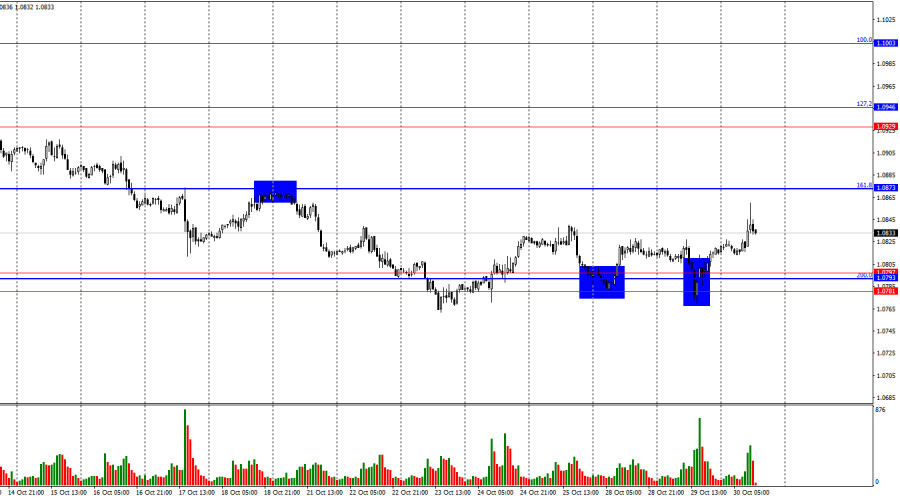
On Tuesday, the EUR/USD pair completed its third rebound from the support zone of 1.0781–1.0797, turning in favor of the euro and starting a new climb toward the much-contested 161.8% corrective level at 1.0873. A rebound from this level would favor the U.S. dollar and prompt a fourth test of the 1.0781–1.0797 zone. Consolidating below this zone would increase the likelihood of a further decline toward the next Fibonacci level of 261.8% at 1.0662.
The wave pattern raises no questions. The last completed upward wave (September 25–30) did not surpass the previous wave's peak, while the new downward wave (still in formation) has broken the lows of the past three waves. Thus, the pair is continuing to form a new bearish trend, particularly its first wave. While a corrective wave could appear soon, bulls have already lost their market momentum. Regaining it would require substantial effort, which is unlikely to happen in the near future.
Tuesday's news backdrop was relatively weak and didn't have a strong impact on the pair's exchange rate. This morning, it was reported that Germany's unemployment rate rose to 6.1% (contrary to traders' expectations), Q3 GDP volumes increased by 0.2% (also unexpected by traders), and Eurozone GDP rose by 0.4% (exceeding forecasts). This prompted a reasonable response from bullish traders, though their buying power was short-lived. The euro rose by 40 points, only to fall by 20 points shortly after. This afternoon, two significant U.S. reports are expected, which will determine the day's overall dynamics. American reports hold greater market importance. Currently, traders still see no compelling reason to buy the euro. With the fourth or fifth test, the 1.0781–1.0797 zone might not hold, leading to another sharp decline in the euro.

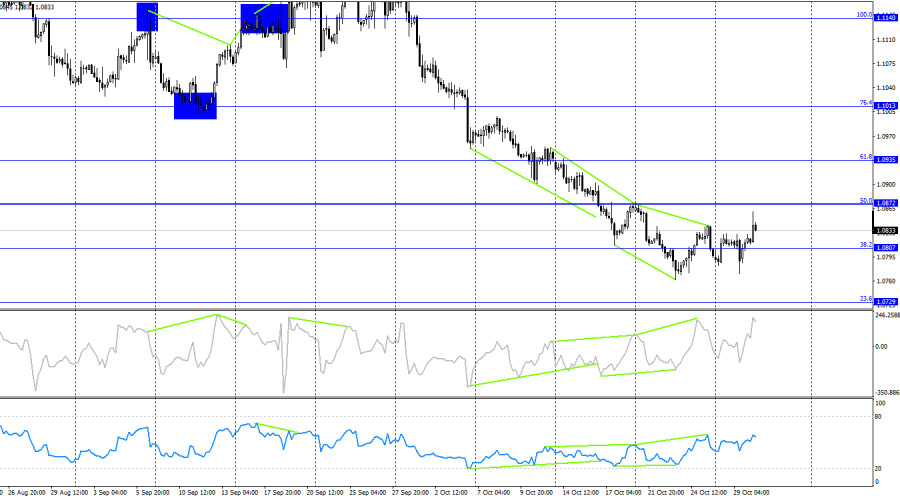
On the 4-hour chart, the pair is attempting to continue its upward movement toward the 50.0% corrective level at 1.0872, but bulls remain very weak. A rebound from this level would suggest a reversal in favor of the U.S. dollar, with a renewed decline toward the 23.6% Fibonacci level at 1.0729. Currently, no divergences are forming on any indicators.
Commitments of Traders (COT) Report:
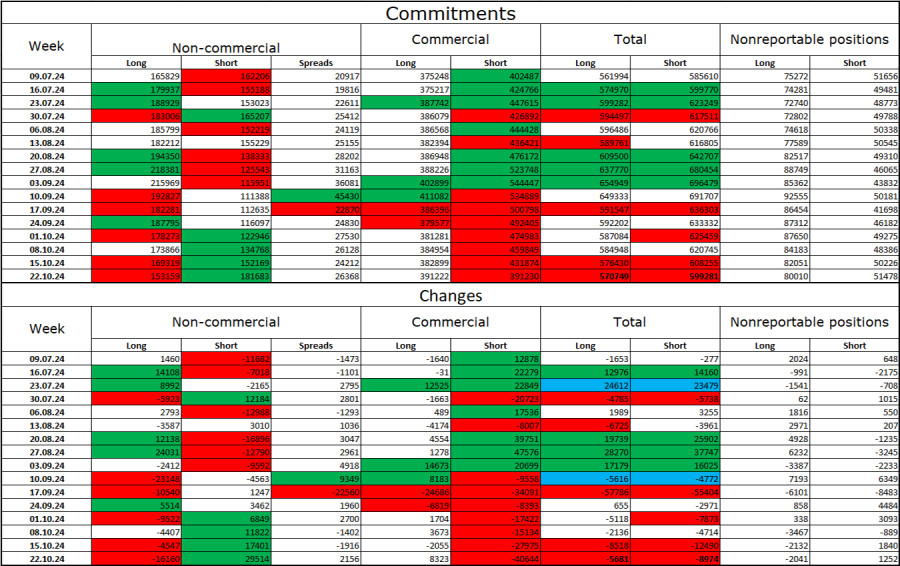
In the latest reporting week, speculators closed 16,160 long positions and opened 29,514 short positions. The sentiment among the "Non-commercial" group shifted to bearish. The total number of long positions held by speculators now stands at 153,000, while short positions total 181,000.
For the seventh consecutive week, major players are unloading the euro. In my view, this could signal the beginning of a new bearish trend or at least a significant correction on a global scale. The key factor driving the dollar's decline—expectations of Fed policy easing—has already been priced in, leaving the market with fewer reasons to offload the dollar. New factors could arise, but for now, further dollar strength seems more likely. Technical analysis also indicates the start of a bearish trend, suggesting a prolonged decline for EUR/USD.
Economic Calendar for the U.S. and Eurozone:
- Eurozone – Germany Unemployment Rate (08:55 UTC)
- Eurozone – Q3 GDP Change in Germany (09:00 UTC)
- Eurozone – Q3 GDP Change (10:00 UTC)
- U.S. – ADP Employment Change (12:15 UTC)
- U.S. – Q3 GDP Change (12:30 UTC)
- Eurozone – Germany Consumer Price Index (13:00 UTC)
On October 30, the economic calendar contains several significant events, half of which have already been released. The impact of this information on market sentiment for the rest of the day is expected to be moderate.
EUR/USD Forecast and Trader Tips:
Selling the pair is possible on a close below the 1.0781–1.0797 zone on the hourly chart, targeting 1.0729, or on a rebound from the 1.0873 level. Buying opportunities existed on a rebound from the 1.0781–1.0797 zone with a target of 1.0873; however, bullish traders are currently very weak, with even the news background offering limited support.
Fibonacci levels are plotted from 1.1003 to 1.1214 on the hourly chart and from 1.1139 to 1.0603 on the 4-hour chart.


