In my morning forecast, I focused on the 1.2560 level and planned to make trading decisions based on it. Let's examine the 5-minute chart to analyze what happened. A drop and the formation of a false breakout provided an entry point for buying the pound. However, this did not lead to a significant upward movement in the pair. Purchases around 1.2495, following a large sell-off in the pair, generated a profit of approximately 40 points. The technical picture has been revised for the second half of the day.
For Opening Long Positions in GBP/USD:
Very weak PMI data from the UK triggered an active sell-off of the British pound in the first half of the day. Activity in the key UK services sector halted growth in November, which is a concerning sign for the entire economy. In the second half of the day, similar reports are expected from the US: the manufacturing PMI, the services PMI, and the composite PMI. A rise in these indicators would provide another reason to sell the pound, even though the pair is trading at weekly and monthly lows.
I will only consider buying the pound after a drop and the formation of a false breakout around the support level of 1.2495. This would confirm a valid entry point for long positions, with a target to recover to the resistance level of 1.2555, formed earlier in the day. A breakout and subsequent retest of this range would present a new opportunity for entering long positions, with the potential to reach 1.2606. The farthest target would be the level around 1.2654, where I plan to take profits.
If GBP/USD continues to decline and there is no bullish activity at 1.2495, which is the monthly low, bears will have an opportunity to establish a new trend. A false breakout around 1.2469 would be the only suitable condition for opening long positions. Alternatively, I plan to buy GBP/USD on a rebound from the 1.2448 low, targeting a 30–35 point intraday correction.
For Opening Short Positions in GBP/USD:
The pressure on the pound is enormous—especially as the Bank of England has decided not to lower interest rates, restricting the economy's access to cheap money and new investments. However, given the low levels the pair is trading at, combined with the approaching end of the week, selling must be approached cautiously.
It is better to wait for the pair to rise and for active bearish movements near the resistance level of 1.2555. A false breakout at this level, paired with strong US data, would create an ideal entry point for selling. The target would be a continued downward movement toward the monthly low of 1.2495. A breakout and retest of this range from below would leave buyers with no opportunities, clearing the path to the 1.2469 low. The farthest target would be the 1.2448 level, where I plan to take profits.
If GBP/USD rises and there is no bearish activity at 1.2555—especially following strong US data—buyers will have a good opportunity for a correction at the end of the week. In this case, bears would likely retreat to the resistance area of 1.2606, where moving averages also align in their favor. I will only sell at this level if a false breakout occurs. If downward movement is absent at this level, I will consider short positions on a rebound from around 1.2654, targeting an intraday correction of 30–35 points.
COT Report (Commitment of Traders):
In the latest COT report, long and short positions were both reduced. The current figures account for Donald Trump's presidency and the Bank of England's interest rate cuts during the November meeting. However, the large reduction in short positions simply indicates that fewer traders are willing to sell at current prices. Meanwhile, as the data shows, there are still no significant buyers, making a major correction in the pound unlikely in the near term.
Considering weak GDP data from the UK, the rationale for buying the pound becomes even weaker. The latest COT report reveals that non-commercial long positions decreased by 745, to a total of 119,992, while short positions decreased by 11,711, to 63,942. Consequently, the gap between long and short positions increased by 1,162.
Indicator Signals:
Moving Averages:
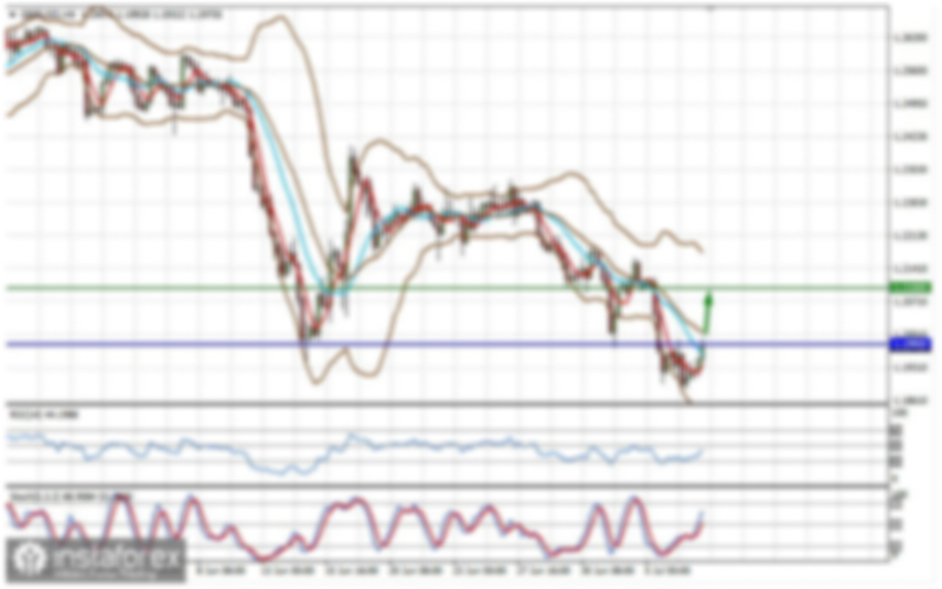
Trading is taking place below the 30-day and 50-day moving averages, signaling further downward pressure on the pair.Note: The author considers moving averages on the hourly chart (H1), which differs from the classical daily moving averages (D1).
Bollinger Bands:
If the pair declines further, the lower boundary of the Bollinger Bands, around 1.2520, will act as a support level.
Indicator Descriptions:
- Moving Average (MA): Defines the current trend by smoothing volatility and noise.
- Period: 50 (shown in yellow on the chart)
- Period: 30 (shown in green on the chart)
- MACD (Moving Average Convergence/Divergence):
- Fast EMA: Period 12
- Slow EMA: Period 26
- SMA: Period 9
- Bollinger Bands: Period 20
- Non-commercial traders: Speculators such as individual traders, hedge funds, and large institutions using the futures market for speculative purposes.
- Long non-commercial positions: Represents the total long open position of non-commercial traders.
- Short non-commercial positions: Represents the total short open position of non-commercial traders.
- Total non-commercial net position: The difference between short and long positions of non-commercial traders.