empty
29.01.2025 04:54 AM
Forecast for Silver on January 29, 2025

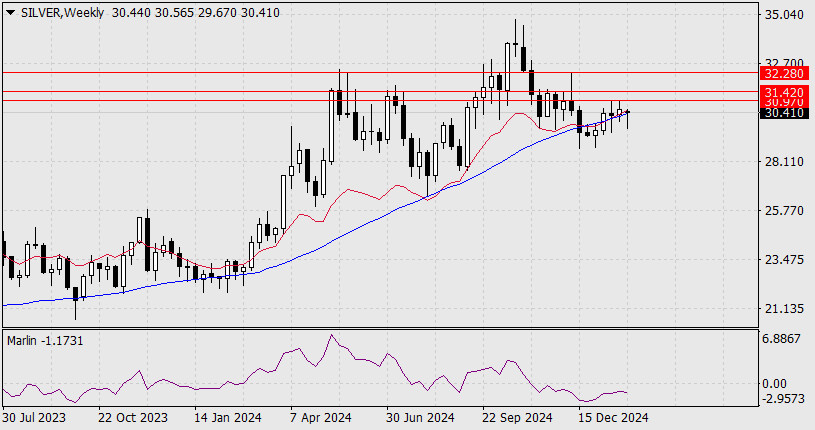
On the weekly chart, silver appears to be firmly positioned above the MACD indicator line, with the bodies of the weekly candlesticks entirely above this line. The only obstacle ahead is the balance line.

This image is no longer relevant

However, the price is likely to attempt a breakout, as the growth potential looks promising if it can overcome the resistance at 30.97, which is the high from the previous week.

This image is no longer relevant

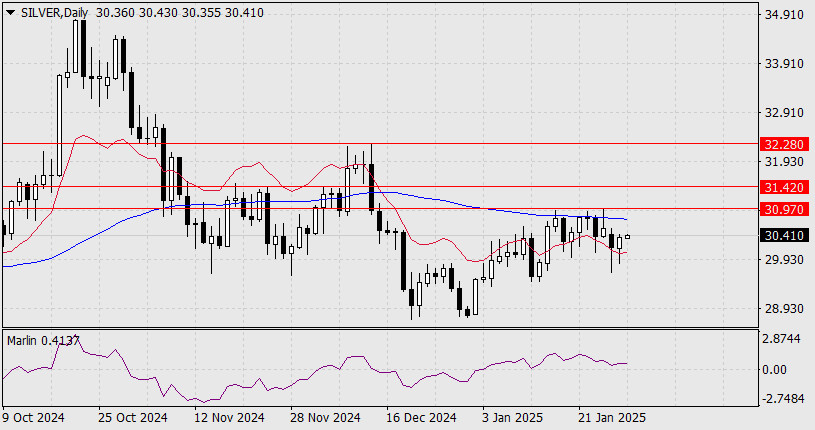
On the daily chart, the Marlin oscillator is developing above the zero line within the growth zone. Before reaching the 30.97 level, the price will need to surpass the MACD line. A breakout above 30.97 would open the door to targets at 31.42 and then 32.28, which is the peak from December 12.

This image is no longer relevant

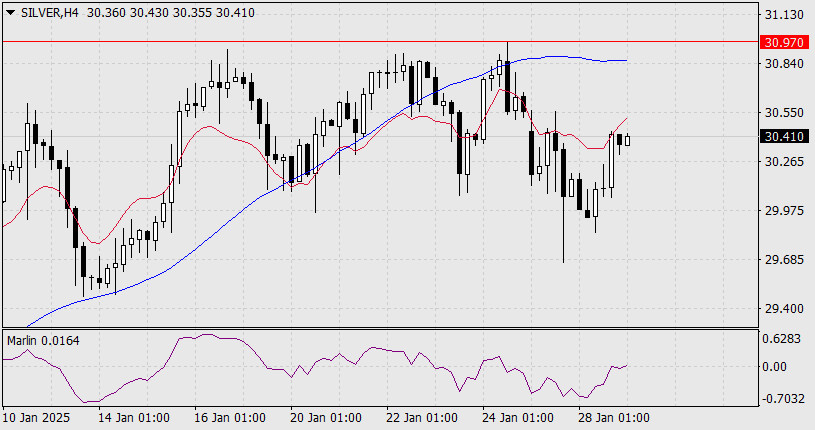
Similarly, on the four-hour chart, the 30.97 level is reinforced by the MACD line. Today's Federal Reserve meeting could potentially provide silver with the needed upward momentum. The Marlin oscillator is positioned for this move, having shifted into positive territory.

Laurie Bailey,
Analytical expert of InstaForex
© 2007-2025
Select timeframe
5
min
15
min
30
min
1
hour
4
hours
1
day
1
week
Earn on cryptocurrency rate changes with InstaForex
Download MetaTrader 4 and open your first trade
  • Grand Choice
    Contest by
    InstaForex
    InstaForex always strives to help you
    fulfill your biggest dreams.
    JOIN CONTEST

Recommended Stories

EUR/USD – April 3rd: The Dollar Suffers Another Collapse

On Wednesday, the EUR/USD pair surged sharply. This movement can hardly be called a mere rise. When it comes to the U.S. dollar, it was another collapse—one of many seen

Samir Klishi 11:25 2025-04-03 UTC+2

GBP/USD – April 3rd: A Pointless End of the Week for the Dollar

On the hourly chart, the GBP/USD pair once again surged upward, breaking through a slew of levels and resistance zones. At this point, the British pound has risen

Samir Klishi 10:51 2025-04-03 UTC+2

Forex forecast 03/04/2025: EUR/USD, USD/JPY, SP500, Gold and Bitcoin

Useful links: My other articles are available in this section InstaForex course for beginners Popular Analytics Open trading account Important: The begginers in forex trading need to be very careful

Sebastian Seliga 09:57 2025-04-03 UTC+2

EUR/USD Forecast for April 3, 2025

Starting today, U.S. tariffs ranging from 10% to 50% will apply to nearly all of America's trading partners. Market participants were prepared and refrained from panic, although equity indices weakened

Laurie Bailey 05:07 2025-04-03 UTC+2

GBP/USD Forecast for April 3, 2025

GBP/USD Yesterday, Trump's sweeping tariffs on U.S. trading partners impacted the UK at the lowest rate—just 10%. In contrast, tariffs on EU goods were set at 20% and on Japanese

Laurie Bailey 05:07 2025-04-03 UTC+2

USD/JPY Forecast for April 3, 2025

USD/JPY After Washington imposed a 24% tariff on Japanese imports, the Nikkei 225 has decreased by 2.71% during today's Pacific session. The USD/JPY pair is falling by roughly 150 pips

Laurie Bailey 05:07 2025-04-03 UTC+2

Oil Forecast for April 3, 2025

Oil (CL) Market participants anticipate a disruption in global trade following President Trump's sweeping tariffs imposed yesterday on all U.S. trading partners. On the daily chart, the upper wick

Laurie Bailey 05:07 2025-04-03 UTC+2

#NDX – March Results and April Outlook

March concluded with a bearish candle that left a notable mark in the history books. Bears closed below the monthly short-term trend level (19,730) and eliminated the weekly golden cross

Evangelos Poulakis 01:07 2025-04-03 UTC+2

Trading Signals for EUR/USD for April 2-5, 2025: sell below 1.0815 (21 SMA - +1/8 Murray)

If the euro breaks and consolidates above the bearish trend channel, we could expect it to reach +1/8 Murray level at 1.0864 in the coming days. EUR/USD could even reach

Dimitrios Zappas 15:18 2025-04-02 UTC+2

Trading Signals for GOLD (XAU/USD) for April 2-5, 2025: sell below $3,140 or buy above $3,110 (21 SMA - symmetrical triangle)

The symmetrical triangle pattern observed on the H4 chart shows that gold could experience a strong bullish impulse to reach 3,169, where resistance R_1 is located. Below this area

Dimitrios Zappas 15:15 2025-04-02 UTC+2
Can't speak right now?
Ask your question in the chat.
Widget callback
 

Dear visitor,

Your IP address shows that you are currently located in the USA. If you are a resident of the United States, you are prohibited from using the services of InstaFintech Group including online trading, online transfers, deposit/withdrawal of funds, etc.

If you think you are seeing this message by mistake and your location is not the US, kindly proceed to the website. Otherwise, you must leave the website in order to comply with government restrictions.

Why does your IP address show your location as the USA?

  • - you are using a VPN provided by a hosting company based in the United States;
  • - your IP does not have proper WHOIS records;
  • - an error occurred in the WHOIS geolocation database.

Please confirm whether you are a US resident or not by clicking the relevant button below. If you choose the wrong option, being a US resident, you will not be able to open an account with InstaForex anyway.

We are sorry for any inconvenience caused by this message.