empty
 
 
20.11.2024 04:43 PM
Forecast for GBP/USD on November 20, 2024

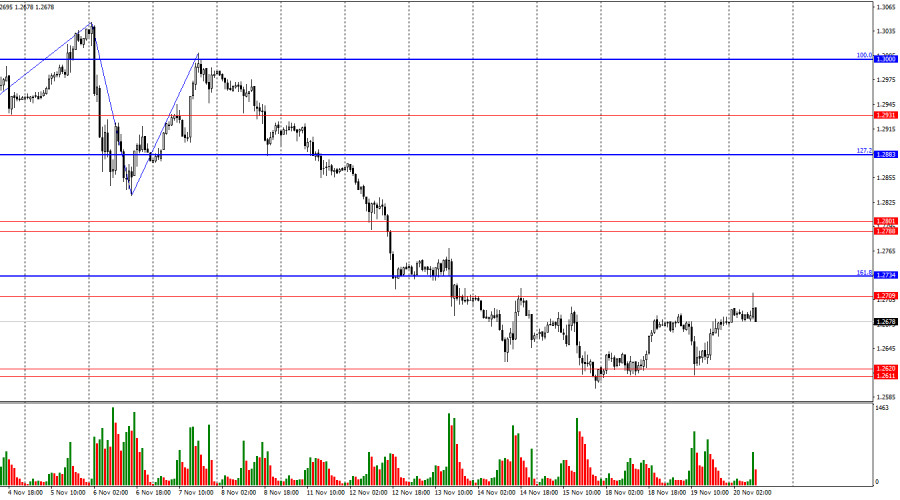
On the hourly chart, the GBP/USD pair rebounded from the support zone of 1.26111.2620 on Tuesday and climbed to the level of 1.2709. The subsequent rebound from 1.2709 favored the U.S. dollar, pushing the pair downward toward the 1.26111.2620 zone. This indicates a sideways trend, with the British pound moving consistently within it.

This image is no longer relevant

The wave structure raises no concerns. The last completed upward wave failed to surpass the previous peak, while the ongoing downward wave has broken the last two lows. Thus, the bearish trend remains intact. To signal its potential end, the pair would need to return to the 1.3000 level and close above the most recent peak.

On Tuesday, there was minimal news background for both the British pound and the U.S. dollar. This morning, UK inflation reports were released, which bulls had placed high hopes on. However, these hopes quickly diminishednot because of the reports themselves. UK inflation rose to 2.3%, surpassing expectations of 2.2%, while core inflation climbed to 3.3% compared to the anticipated decline to 3.1%. These reports confirm Andrew Bailey's concerns about rising inflation in the near future. While rising inflation suggests the Bank of England is unlikely to adopt aggressive monetary easing policies at every meeting, it also indicates that rate cuts will likely occur at a slower pace. At first glance, this seems favorable for the pound. However, I have previously noted that favorable news alone is insufficient. Bulls require the motivation to act, and the news serves only as a supportive factor. Today's trading activity (at the time of writing) shows little to no bullish momentum, or perhaps a complete absence of bullish participants in the market. Even the positive inflation data has only led to further declines in the pound.

This image is no longer relevant

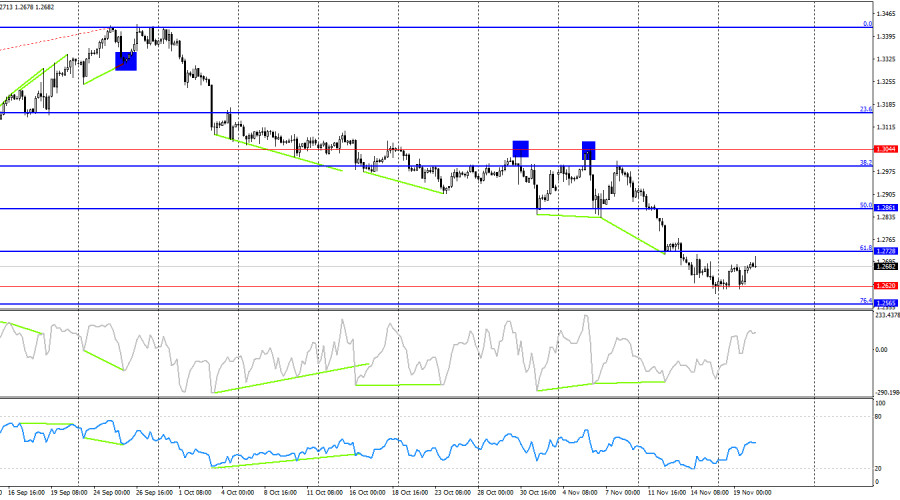
On the 4-hour chart, the pair has declined to the 1.2620 level. A rebound from this level and subsequent rise seems unlikely. If the pair closes below the 1.2620 level, it would increase the probability of further declines toward the 76.4% Fibonacci retracement level at 1.2565. Bullish divergences, which have appeared regularly, are currently irrelevant to traders.

Commitments of Traders (COT) Report:

This image is no longer relevant

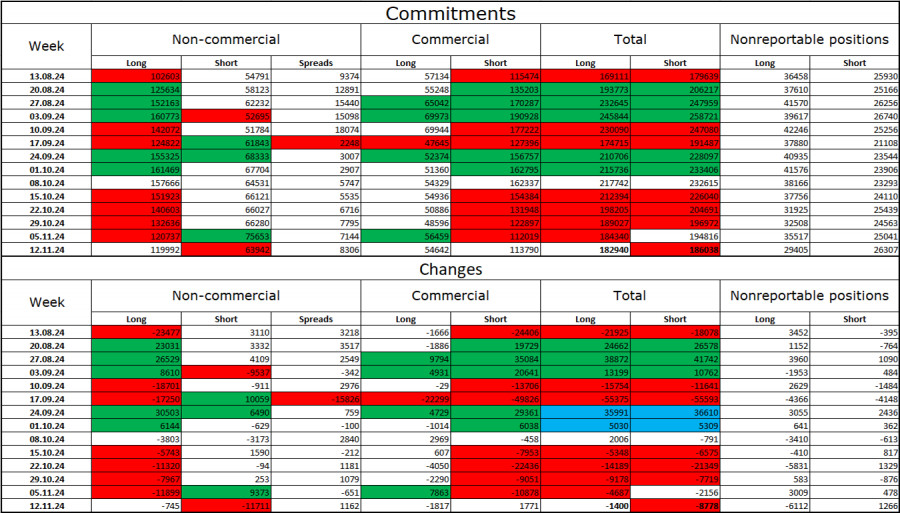
According to the Commitments of Traders (COT) data, sentiment among "Non-commercial" traders turned more bullish during the last reporting week. The number of long positions held by speculators decreased by 745, while the number of short positions saw a significant drop of 11,711. Despite this, bulls still hold a substantial advantage, with 120,000 long positions compared to 64,000 short positions.

In my view, the pound remains poised for further declines, as even the COT data points to strengthening bearish sentiment. Over the past three months, the number of long positions has risen from 102,000 to 120,000, while short positions have increased from 55,000 to 64,000. I believe professional traders will likely continue reducing long positions or increasing short positions, as most factors supporting the pound have already been priced in. Technical analysis also aligns with this bearish outlook.

News Calendar for the USA and the UK:

  • UK Consumer Price Index (07:00 UTC)
  • USA Building Permits (13:30 UTC)
  • USA New Home Sales (13:30 UTC)

On Wednesday, the economic calendar contains only one already-released UK report. The impact of the news background on trader sentiment for the rest of the day is expected to be moderate.

GBP/USD Forecast and Trading Tips:

Selling the pair was possible after a rebound on the 4-hour chart from the 1.3044 level, targeting 1.2931. This target was achieved twice. Subsequent targets at 1.2931, 1.2892, 1.27881.2801, 1.2752, and 1.26111.2620 have also been reached. A close below the 1.26111.2620 zone would allow traders to maintain sell positions with further targets at 1.2570 and 1.2517. The pair can also be sold after a rebound from the 1.27091.2434 zone. Given the current bearish trend, buying the pair is not recommended.

Fibonacci levels are drawn from 1.3000 to 1.3432 on the hourly chart and from 1.2299 to 1.3432 on the 4-hour chart.

Samir Klishi,
انسٹافاریکس کا تجزیاتی ماہر
© 2007-2024
انسٹافاریکس کے ساتھ کرپٹو کرنسی کی معاملاتی تبدیلیوں سے کمائیں۔
میٹا ٹریڈر 4 ڈاؤن لوڈ کریں اور اپنی پہلی ٹریڈ کھولیں۔
  • Grand Choice
    Contest by
    InstaForex
    InstaForex always strives to help you
    fulfill your biggest dreams.
    مقابلہ میں شامل ہوں
  • چانسی ڈیپازٹ
    اپنے اکاؤنٹ میں 3000 ڈالر جمع کروائیں اور حاصل کریں$5000 مزید!
    ہم نومبر قرعہ اندازی کرتے ہیں $5000چانسی ڈیپازٹ نامی مقابلہ کے تحت
    اپنے اکاؤنٹ میں 3000 ڈالر جمع کروانے پر موقع حاصل کریں - اس شرط پر پورا اُترتے ہوئے اس مقابلہ میں شرکت کریں
    مقابلہ میں شامل ہوں
  • ٹریڈ وائز، ون ڈیوائس
    کم از کم 500 ڈالر کے ساتھ اپنے اکاؤنٹ کو ٹاپ اپ کریں، مقابلے کے لیے سائن اپ کریں، اور موبائل ڈیوائسز جیتنے کا موقع حاصل کریں۔
    مقابلہ میں شامل ہوں
  • 100 فیصد بونس
    اپنے ڈپازٹ پر 100 فیصد بونس حاصل کرنے کا آپ کا منفرد موقع
    بونس حاصل کریں
  • 55 فیصد بونس
    اپنے ہر ڈپازٹ پر 55 فیصد بونس کے لیے درخواست دیں
    بونس حاصل کریں
  • 30 فیصد بونس
    ہر بار جب آپ اپنا اکاؤنٹ ٹاپ اپ کریں تو 30 فیصد بونس حاصل کریں
    بونس حاصل کریں

تجویز کردہ مضامین

ابھی فوری بات نہیں کرسکتے ؟
اپنا سوال پوچھیں بذریعہ چیٹ.
Widget callback