empty
22.11.2024 07:20 AM
Trading Recommendations and Trade Analysis for GBP/USD on November 22: The Pound Follows the Euro

GBP/USD 5-Minute Analysis

This image is no longer relevant

On Thursday, the GBP/USD pair continued to trade downward. Like the euro, the British pound had no significant reasons to fall during the day. However, this is irrelevant. We have often stated that the pound sterling is overbought and has risen over the past two years primarily due to expectations of future monetary policy easing by the Federal Reserve. The market is priced in the entire rate-cut cycle "in advance." We are now witnessing a reversal because factors like the Bank of England easing or the UK's and US's economic states have been overlooked for the same two years.

At first glance, it seems paradoxical that the Fed cuts rates while the dollar strengthens. However, this is precisely the scenario we warned traders about throughout 2024. Thus, the pair no longer requires specific macroeconomic or fundamental reasons to trend downward almost daily.

On Thursday, there were no significant events in the UK, while the US saw minor reports on jobless claims and new home sales. We strongly doubt that these reports caused the market to continue buying dollars after two months of virtually uninterrupted growth. Both reports were not optimistic enough to justify an additional 70-pip rally for the dollar.

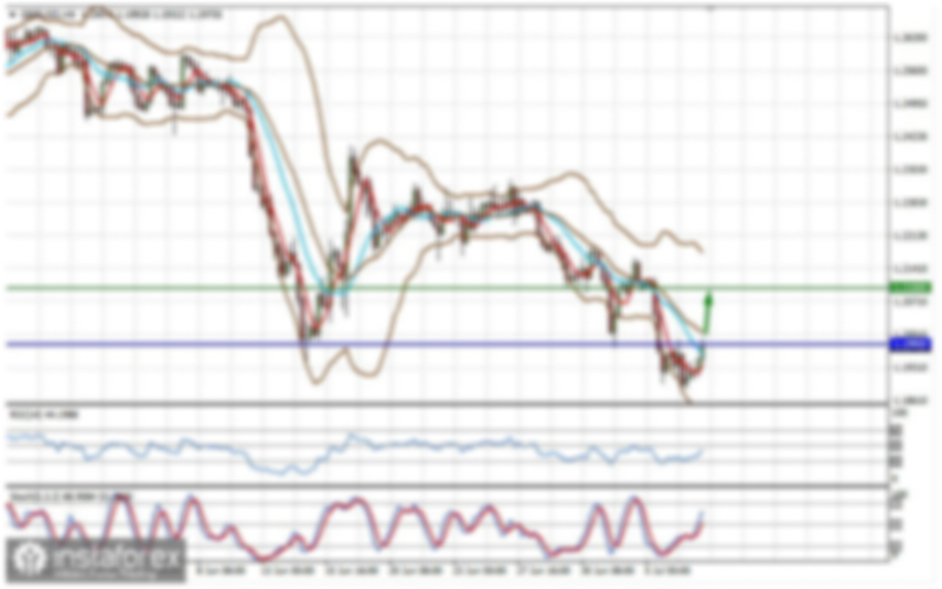
Further declines should be expected now that the pound has broken out of its horizontal channel. The nearest target is the 1.2516 level. Yesterday, two solid signals were generated near the critical line, though intraday movements remained somewhat chaotic. However, the most critical outcome is that the price broke through the 1.2605–1.2620 area, signaling potential further declines.

COT Report

This image is no longer relevant

The COT reports on the British pound show that commercial traders' sentiment has been highly volatile in recent years. The red and blue lines representing the net positions of commercial and non-commercial traders frequently intersect and usually hover near the zero mark. The most recent downward trend coincided with the red line being below zero. Currently, the red line is above zero.

According to the latest COT report, the non-commercial group closed 700 BUY contracts and 11,700 SELL contracts. As a result, the net position of non-commercial traders grew by 11,000 contracts over the week. While the market is not rushing to sell the pound sterling in the medium term, the movements of the past six weeks are encouraging.

The fundamental backdrop still provides no basis for long-term pound purchases, and the pound has a realistic chance of resuming its global downtrend. However, on the weekly timeframe, there is an upward trendline. Until this trendline is broken, long-term expectations of a decline in the pound remain speculative. For now, the pound continues to demonstrate significant resilience against the dollar.

GBP/USD 1-Hour Analysis

This image is no longer relevant

The GBP/USD pair maintains a generally bearish bias on the hourly timeframe. The previous upward trend has been nullified, and further declines in the pound are expected to be significant and prolonged. The last correction was flat and has already concluded. A new corrective flat also ended. No fundamental reasons justify substantial growth in the pound; even the UK inflation report failed to support it.

For November 22, we highlight the following important levels: 1.2429-1.2445, 1.2516, 1.2605-1.2620, 1.2796-1.2816, 1.2863, 1.2981-1.2987, and 1.3050. Senkou Span B (1.2803) and Kijun-sen (1.2643) lines can also be sources of signals. Setting the Stop Loss level at breakeven when the price passes 20 pips in the right direction is recommended. The Ichimoku indicator lines can move during the day, which should be considered when determining trading signals.

On Friday, the UK will release PMI reports, though it's worth noting that S&P indices hold limited significance for the dollar compared to US ISM reports. The UK will also publish a retail sales report, while the US will release the University of Michigan consumer sentiment index.

Chart Explanations:

Support and resistance levels: thick red lines around which movement may end. They are not sources of trading signals.

Kijun-sen and Senkou Span B lines: Ichimoku indicator lines transferred from the 4-hour to the 1-hour timeframe. These are strong lines.

Extreme levels: thin red lines where the price previously rebounded. They are sources of trading signals.

Yellow lines: Trend lines, trend channels, and other technical patterns.

Indicator 1 on COT charts: The net position size for each category of traders.

Paolo Greco,
Analytical expert of InstaForex
© 2007-2025
Select timeframe
5
min
15
min
30
min
1
hour
4
hours
1
day
1
week
Earn on cryptocurrency rate changes with InstaForex
Download MetaTrader 4 and open your first trade
  • Grand Choice
    Contest by
    InstaForex
    InstaForex always strives to help you
    fulfill your biggest dreams.
    JOIN CONTEST

Recommended Stories

How to Trade the GBP/USD Pair on March 28? Simple Tips and Trade Analysis for Beginners

Analysis of Thursday's Trades 1H Chart of GBP/USD On Thursday, the GBP/USD pair also traded higher—and quite strongly. Despite the release of a reasonably solid Q4 GDP report

Paolo Greco 06:05 2025-03-28 UTC+2

How to Trade the EUR/USD Pair on March 28? Simple Tips and Trade Analysis for Beginners

Analysis of Thursday's Trades 1H Chart of EUR/USD The EUR/USD currency pair rose to the 1.0804 level on Thursday. Naturally, such an unexpected and relatively strong rise in the euro

Paolo Greco 06:05 2025-03-28 UTC+2

Trading Recommendations and Analysis for GBP/USD on March 28: The Pound Keeps Swinging

The GBP/USD currency pair showed a powerful upward movement on Thursday. Naturally, the catalyst was once again Donald Trump, who imposed new 25% tariffs on all automobile imports

Paolo Greco 02:47 2025-03-28 UTC+2

Trading Recommendations and Analysis for EUR/USD on March 28: Trump's Tariffs and GDP

On Thursday, the EUR/USD currency pair surged sharply without breaking the prevailing downtrend of recent days. Valid reasons contributed to the dollar's decline after Donald Trump announced new tariffs

Paolo Greco 02:47 2025-03-28 UTC+2

GBP/USD: Trading Plan for the U.S. Session on March 27th (Review of Morning Trades)

In my morning forecast, I focused on the 1.2916 level and planned to make trading decisions based on it. Let's look at the 5-minute chart and see what happened

Miroslaw Bawulski 17:56 2025-03-27 UTC+2

EUR/USD: Trading Plan for the U.S. Session on March 27th (Review of Morning Trades)

In my morning forecast, I focused on the 1.0769 level and planned to make trading decisions based on it. Let's take a look at the 5-minute chart and see what

Miroslaw Bawulski 17:53 2025-03-27 UTC+2

How to Trade the GBP/USD Pair on March 27? Simple Tips and Trade Analysis for Beginners

Analysis of Wednesday's Trades 1H Chart of GBP/USD On Wednesday, the GBP/USD pair showed a downward movement that finally aligned with the macroeconomic backdrop. During the day, traders were interested

Paolo Greco 05:42 2025-03-27 UTC+2

How to Trade the EUR/USD Pair on March 27? Simple Tips and Trade Analysis for Beginners

Analysis of Wednesday's Trades 1H Chart of EUR/USD On Wednesday, the EUR/USD currency pair continued its sluggish decline. The euro's depreciation is quite logical, although traders continue to ignore

Paolo Greco 05:42 2025-03-27 UTC+2

Trading Recommendations and Analysis for GBP/USD on March 27: Pound Dropped, but Nothing Has Changed

The GBP/USD currency pair traded lower on Wednesday. We had warned that the pair has recently been swinging like a pendulum. The pound was rising on Tuesday, so it could

Paolo Greco 03:06 2025-03-27 UTC+2

Trading Recommendations and Analysis for EUR/USD on March 27: The Market Is in No Hurry

The EUR/USD currency pair traded with minimal losses throughout Wednesday, while the overall trend on the hourly time frame remains bearish following the price's exit from the ascending channel

Paolo Greco 03:06 2025-03-27 UTC+2
Can't speak right now?
Ask your question in the chat.
Widget callback
 

Dear visitor,

Your IP address shows that you are currently located in the USA. If you are a resident of the United States, you are prohibited from using the services of InstaFintech Group including online trading, online transfers, deposit/withdrawal of funds, etc.

If you think you are seeing this message by mistake and your location is not the US, kindly proceed to the website. Otherwise, you must leave the website in order to comply with government restrictions.

Why does your IP address show your location as the USA?

  • - you are using a VPN provided by a hosting company based in the United States;
  • - your IP does not have proper WHOIS records;
  • - an error occurred in the WHOIS geolocation database.

Please confirm whether you are a US resident or not by clicking the relevant button below. If you choose the wrong option, being a US resident, you will not be able to open an account with InstaForex anyway.

We are sorry for any inconvenience caused by this message.