Actual patterns
Patterns are graphical models which are formed in the chart by the price. According to one of the technical analysis postulates, history (price movement) repeats itself. It means that the price movements are often similar in the same situations which makes it possible to predict the further development of the situation with a high probability.
Actual Patterns
- All
- Double Top
- Flag
- Head and Shoulders
- Pennant
- Rectangle
- Triangle
- Triple top
- All
- #AAPL
- #AMZN
- #Bitcoin
- #EBAY
- #FB
- #GOOG
- #INTC
- #KO
- #MA
- #MCD
- #MSFT
- #NTDOY
- #PEP
- #TSLA
- #TWTR
- AUDCAD
- AUDCHF
- AUDJPY
- AUDUSD
- EURCAD
- EURCHF
- EURGBP
- EURJPY
- EURNZD
- EURRUB
- EURUSD
- GBPAUD
- GBPCHF
- GBPJPY
- GBPUSD
- GOLD
- NZDCAD
- NZDCHF
- NZDJPY
- NZDUSD
- SILVER
- USDCAD
- USDCHF
- USDJPY
- USDRUB
- All
- M5
- M15
- M30
- H1
- D1
- All
- Buy
- Sale
- All
- 1
- 2
- 3
- 4
- 5

The USDCAD M5 formed the Head and Shoulders pattern with the following features: The Head’s top is at 1.4295, the Neckline and the upward angle are at 1.4237/1.4245. The formation
The M5 and M15 time frames may have more false entry points.
Open chart in a new window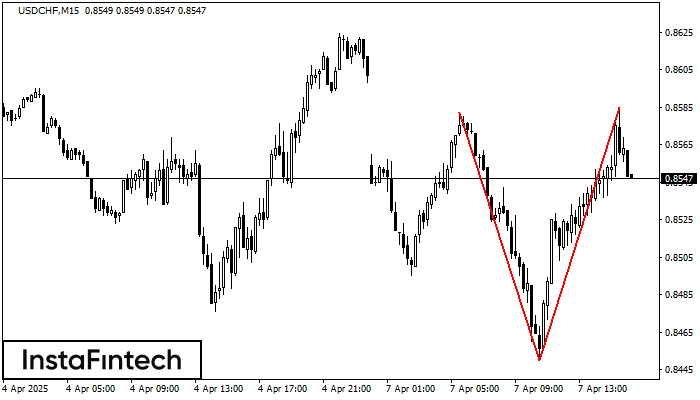
The Double Top pattern has been formed on USDCHF M15. It signals that the trend has been changed from upwards to downwards. Probably, if the base of the pattern 0.8450
The M5 and M15 time frames may have more false entry points.
Open chart in a new window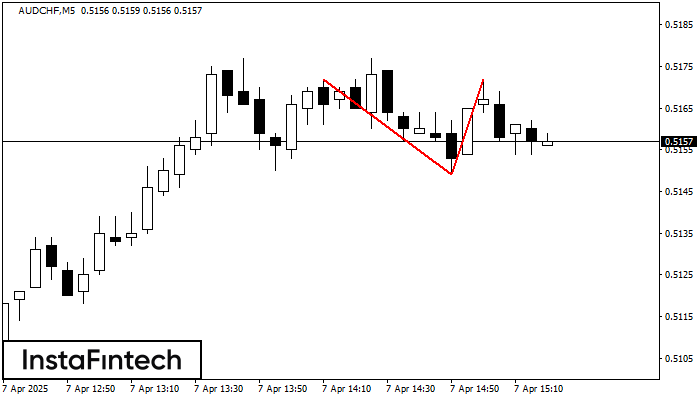
The Double Top pattern has been formed on AUDCHF M5. It signals that the trend has been changed from upwards to downwards. Probably, if the base of the pattern 0.5149
The M5 and M15 time frames may have more false entry points.
Open chart in a new window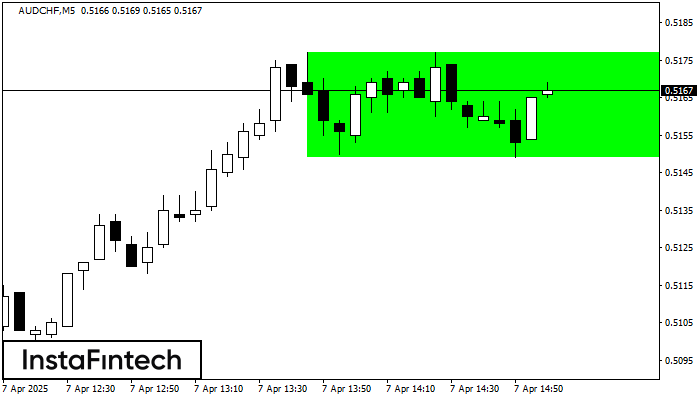
According to the chart of M5, AUDCHF formed the Bullish Rectangle. This type of a pattern indicates a trend continuation. It consists of two levels: resistance 0.5177 and support 0.5149
The M5 and M15 time frames may have more false entry points.
Open chart in a new window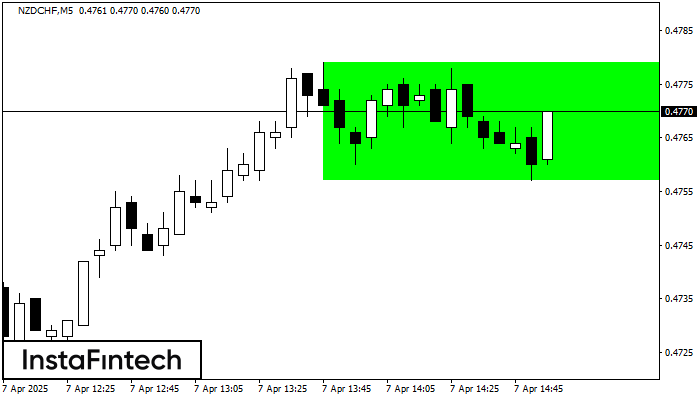
According to the chart of M5, NZDCHF formed the Bullish Rectangle which is a pattern of a trend continuation. The pattern is contained within the following borders: the lower border
The M5 and M15 time frames may have more false entry points.
Open chart in a new window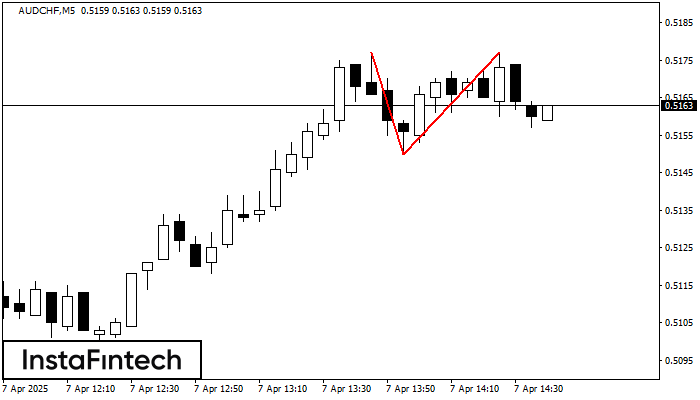
The Double Top pattern has been formed on AUDCHF M5. It signals that the trend has been changed from upwards to downwards. Probably, if the base of the pattern 0.5150
The M5 and M15 time frames may have more false entry points.
Open chart in a new window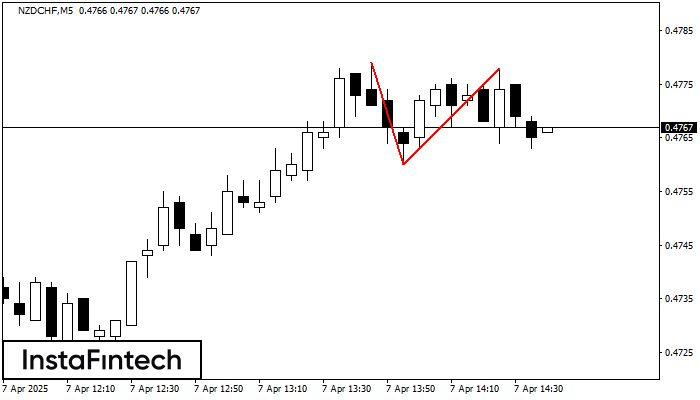
On the chart of NZDCHF M5 the Double Top reversal pattern has been formed. Characteristics: the upper boundary 0.4778; the lower boundary 0.4760; the width of the pattern 18 points
The M5 and M15 time frames may have more false entry points.
Open chart in a new window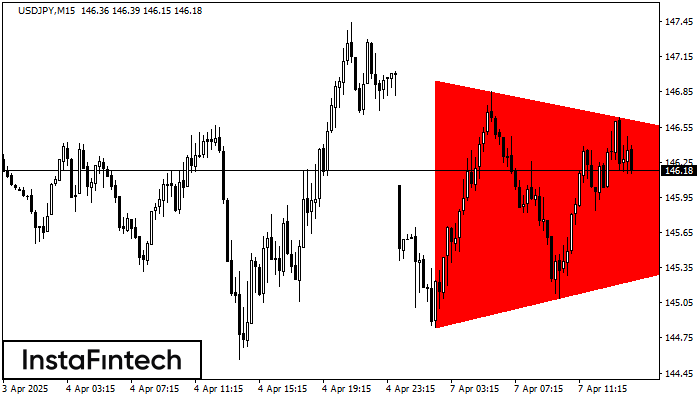
According to the chart of M15, USDJPY formed the Bearish Symmetrical Triangle pattern. Description: The lower border is 144.84/145.98 and upper border is 146.95/145.98. The pattern width is measured
The M5 and M15 time frames may have more false entry points.
Open chart in a new window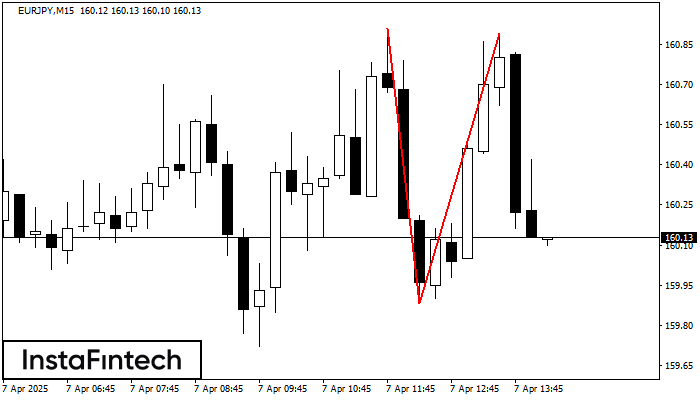
The Double Top pattern has been formed on EURJPY M15. It signals that the trend has been changed from upwards to downwards. Probably, if the base of the pattern 159.88
The M5 and M15 time frames may have more false entry points.
Open chart in a new window