empty
25.10.2021 01:00 PM
Technical analysis recommendations of EUR/USD and GBP/USD on October 25

EUR/USD

This image is no longer relevant

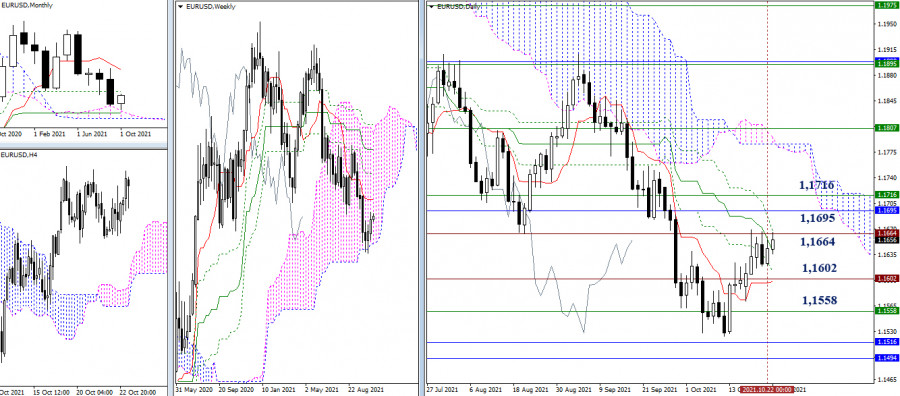
The slowdown below the historical resistance of 1.1664 remains. The final level of the Ichimoku daily dead cross (1.1667) has fallen into this area today. As a result, the breakdown of resistance will eliminate the bearish cross and help the bulls to strengthen their positions. The next upward targets are still at 1.1695 (monthly Fibo Kijun) and 1.1716 (weekly Tenkan). But in the case of bearish activity, the nearest support level of 1.1602 (historical level + daily levels) will be considered. The next interests can be directed to interacting with the level of 1.1558 (lower border of the weekly cloud) and 1.1516 - 1.1494 (monthly levels).

This image is no longer relevant

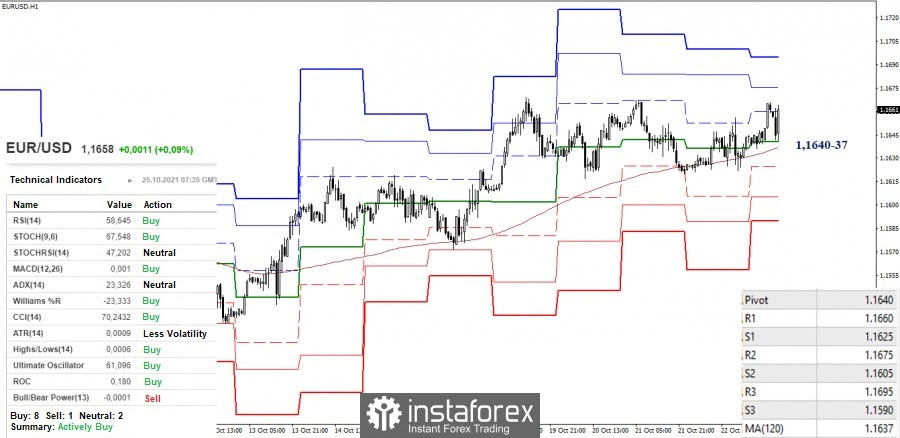
The pair continues to remain in the zone of the downward correction in the smaller timeframes. For a long time, the key support levels are being tested. They are joining forces in the area of 1.1640-37 today. A breakdown, consolidation below, and a reversal of moving averages will change the current balance of power in favor of the bears. The support for the classic pivot levels 1.1625 - 1.1605 - 1.1590 will serve as the intraday downward pivot points.

As for the bulls, the main task is to restore the upward trend (1.1669). The next upward pivot points can be 1.1675 (R2) and 1.1695 (R3), these resistances are being strengthened from the higher timeframes.

GBP/USD

This image is no longer relevant

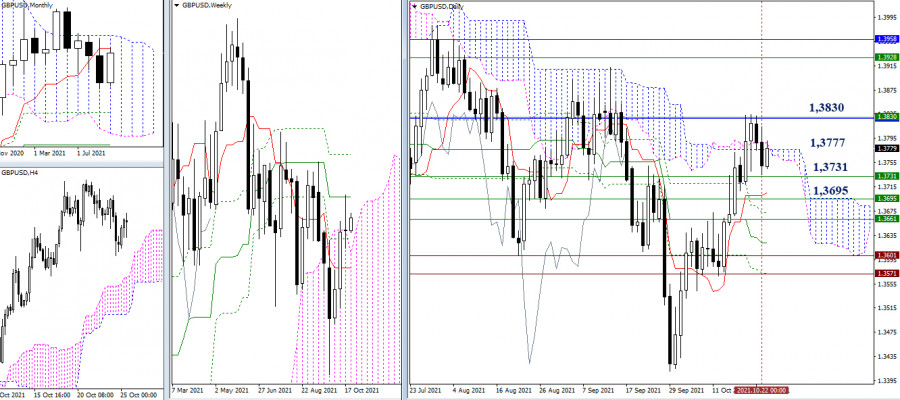
The bulls could not hold their positions below the encountered resistance level of 1.3830 (monthly short-term trend + weekly medium-term trend) during last week's closing. Currently, the attraction zone continues to provide a daily cloud (1.3777). The nearest support levels are set sequentially with some distance from each other – 1.3731 - 1.3695 - 1.3661 (daily and weekly levels).

This image is no longer relevant

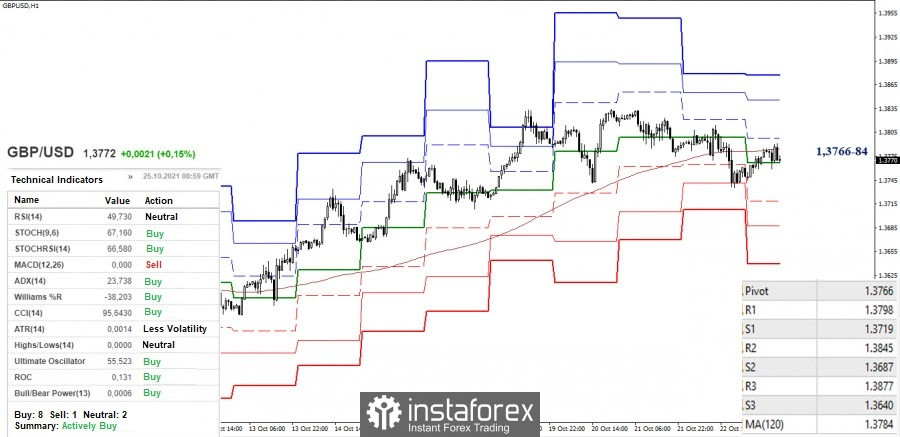
There is a struggle to reach the key levels in the smaller timeframes, which are uniting in the area of 1.3766-84 (central pivot level + weekly long-term trend). The continuation of the decline after the update of the low (1.3735) will open the way to the supports of the classic pivot levels (1.3719 - 1.3687 - 1.3640). On the contrary, a consolidation above the range of 1.3766-84 will set the task to recover the upward trend (1.3834). The resistances of the classic pivot levels 1.3845 and 1.3877 can be the additional upward pivot points within the day.

***

Ichimoku Kinko Hyo (9.26.52) and Kijun-sen levels in the higher time frames, as well as classic Pivot Points and Moving Average (120) on the H1 chart, are used in the technical analysis of the trading instruments.

Pilih carta masa
5
min
15
min
30
min
1
jam
4
jam
1
hari
1
minggu
Jana pendapatan melalui perubahan kadar mata wang kripto dengan InstaForex.
Muat turun MetaTrader 4 dan buka dagangan pertama anda.
  • Grand Choice
    Contest by
    InstaForex
    InstaForex always strives to help you
    fulfill your biggest dreams.
    SERTAI PERADUAN

Artikel yang dicadangkan

Isyarat Dagangan untuk EUR/USD bagi 5-8 Mei, 2025: jual di bawah 1.1370 (200 EMA - 6/8 Murray)

Awal sesi Amerika, pasangan EUR/USD didagang sekitar 1.1345, mencapai puncak saluran penurunan harga dan menunjukkan tanda-tanda keletihan. Euro mungkin menyambung semula kitaran penurunan jika ia mengukuh di bawah 1.1370 dalam

Dimitrios Zappas 17:34 2025-05-05 UTC+2

EUR/USD. Keputusan Mesyuarat Fed Mungkin Menyebabkan Pasangan Ini Menurun

Pertukaran mata wang sedang mengukuh dalam julat sempit di bawah tahap rintangan 1.1345 sementara menunggu keputusan mesyuarat dasar monetari Fed, yang akan berakhir pada hari Rabu, 7 Mei. Jika

Pati Gani 10:59 2025-05-05 UTC+2

EUR/USD – 5 Mei: Pasaran Buruh A.S. Tidak Berputus Asa

Pada hari Jumaat, pasangan EUR/USD meningkat ke tahap 1.1374, melantun semula, dan berbalik memihak kepada dolar A.S. Pemain pasaran menurun menyerang lagi, tetapi hanya seketika, dan secara keseluruhannya mereka masih

Samir Klishi 10:57 2025-05-05 UTC+2

Analisis Teknikal Pergerakan Harga Harian Instrumen Komoditi Emas, Isnin 5 Mei 2025.

Dengan munculnya corak Wedge Gagal pada carta 4 jam, ia memberikan petunjuk bahawa dalam masa terdekat ia berpotensi untuk menuju ke tahap 3297.43 dan jika momentum serta volatiliti menyokong, Emas

Arief Makmur 08:23 2025-05-05 UTC+2

Analisis Teknikal Pergerakan Harga Intraday bagi Pasangan Mata Wang Bersilang EUR/JPY, Isnin 05 Mei 2025.

Dengan merujuk kepada carta 4 jam bagi pasangan silang mata wang EUR/JPY, dapat diperhatikan bahawa dalam masa terdekat EUR/JPY berpotensi untuk mengukuh. Ini disahkan oleh kemunculan corak Penumpuan antara pergerakan

Arief Makmur 08:23 2025-05-05 UTC+2

Analisis Teknikal Pergerakan Harga Harian Indeks Nasdaq 100, Jumaat 02 Mei 2025.

Daripada apa yang dilihat pada carta 4-jam indeks Nasdaq 100, penunjuk Pengayun Stochastic berada dalam keadaan 'Crossing SELL' dan terdapat kemunculan corak 'Rising Wedge' jadi berdasarkan dua keadaan ini dalam

Arief Makmur 08:04 2025-05-02 UTC+2

Isyarat Dagangan untuk EMAS (XAU/USD) bagi 1-3 Mei 2025: beli di atas $3,203 (200 EMA - 5/8 Murray)

Harga logam kuning dijangka bergerak antara 3,203 dan boleh mencapai bahagian bawah saluran menurun sekitar 3,181 dalam beberapa hari akan datang, satu tahap yang bertepatan dengan 200 EMA pada 3,173

Dimitrios Zappas 17:49 2025-05-01 UTC+2

Isyarat Dagangan untuk EUR/USD bagi 30 April 2025: jual di bawah 1.1376 (21 SMA - 7/8 Murray)

pada awal sesi Amerika, pasangan EUR/USD didagangkan sekitar 1.1378 dalam saluran aliran menurun yang terbentuk pada 17 April dan menunjukkan tanda-tanda keletihan kekuatan menaik. Pembetulan teknikal berkemungkinan berlaku dalam beberapa

Dimitrios Zappas 17:37 2025-04-30 UTC+2

Isyarat Dagangan EMAS (XAU/USD) untuk 30 April 2025: beli di atas $3,270 (21 SMA - 6/8 Murray)

Pada awal sesi dagangan Amerika, emas didagangkan sekitar 3,384 — berada di atas paras sokongan utama dan menunjukkan lantunan selepas menyentuh paras rendah 3,267. Sekiranya harga berjaya membuat penyatuan kukuh

Dimitrios Zappas 15:07 2025-04-30 UTC+2

Analisis Teknikal Pergerakan Harga Harian Pasangan Mata Wang Silang AUD/JPY, Rabu, 30 April 2025.

Dengan kemunculan pola Divergent dan Descending Broadening Wedge pada carta 4 jam bagi pasangan mata wang silang AUD/JPY, walaupun pergerakan harganya berada di bawah EMA (21) yang mempunyai cerun menurun

Arief Makmur 06:19 2025-04-30 UTC+2
Tidak boleh bertanya sekarang?
Tanya soalan anda di Ruangan bersembang.
Panggilan semula Widget
 

Dear visitor,

Your IP address shows that you are currently located in the USA. If you are a resident of the United States, you are prohibited from using the services of InstaFintech Group including online trading, online transfers, deposit/withdrawal of funds, etc.

If you think you are seeing this message by mistake and your location is not the US, kindly proceed to the website. Otherwise, you must leave the website in order to comply with government restrictions.

Why does your IP address show your location as the USA?

  • - you are using a VPN provided by a hosting company based in the United States;
  • - your IP does not have proper WHOIS records;
  • - an error occurred in the WHOIS geolocation database.

Please confirm whether you are a US resident or not by clicking the relevant button below. If you choose the wrong option, being a US resident, you will not be able to open an account with InstaForex anyway.

We are sorry for any inconvenience caused by this message.