signal strength 1 of 5
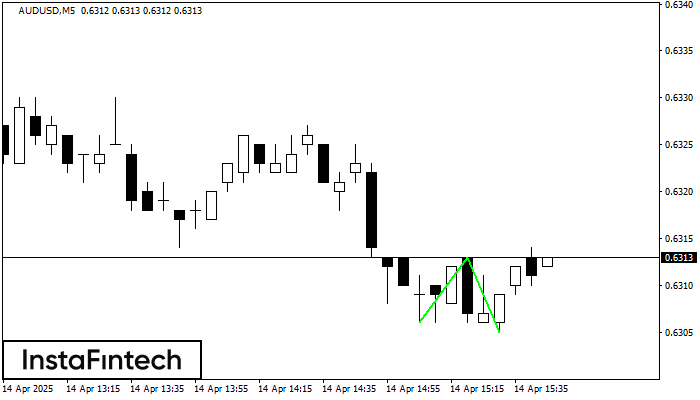
The Double Bottom pattern has been formed on AUDUSD M5; the upper boundary is 0.6313; the lower boundary is 0.6305. The width of the pattern is 7 points. In case of a break of the upper boundary 0.6313, a change in the trend can be predicted where the width of the pattern will coincide with the distance to a possible take profit level.
The M5 and M15 time frames may have more false entry points.
Juga lihat
- All
- Double Top
- Flag
- Head and Shoulders
- Pennant
- Rectangle
- Triangle
- Triple top
- All
- #AAPL
- #AMZN
- #Bitcoin
- #EBAY
- #FB
- #GOOG
- #INTC
- #KO
- #MA
- #MCD
- #MSFT
- #NTDOY
- #PEP
- #TSLA
- #TWTR
- AUDCAD
- AUDCHF
- AUDJPY
- AUDUSD
- EURCAD
- EURCHF
- EURGBP
- EURJPY
- EURNZD
- EURRUB
- EURUSD
- GBPAUD
- GBPCHF
- GBPJPY
- GBPUSD
- GOLD
- NZDCAD
- NZDCHF
- NZDJPY
- NZDUSD
- SILVER
- USDCAD
- USDCHF
- USDJPY
- USDRUB
- All
- M5
- M15
- M30
- H1
- D1
- All
- Buy
- Sale
- All
- 1
- 2
- 3
- 4
- 5

Corak Triple Bottom telah dibentuk pada #KO M5. Ia mempunyai ciri-ciri berikut: tahap rintangan 71.64/71.57; tahap sokongan 71.39/71.35; lebar corak adalah 25 mata. Dalam situasi penembusan paras rintangan 71.64, harga
Carta masa M5 dan M15 mungkin mempunyai lebih banyak titik kemasukan palsu.
Open chart in a new window
According to M5, NZDCAD is shaping the technical pattern – the Inverse Head dan Shoulder. In case the Neckline 0.8179/0.8176 is broken out, the instrument is likely to move toward
Carta masa M5 dan M15 mungkin mempunyai lebih banyak titik kemasukan palsu.
Open chart in a new window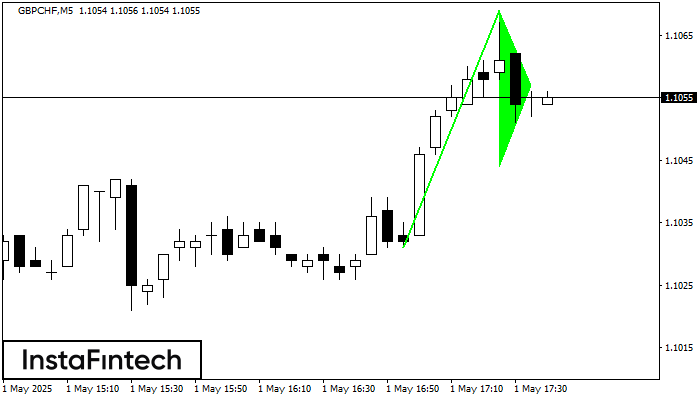
Isyarat Pennant Aliran Menaik – Instrumen dagangan GBPCHF M5, corak kesinambungan. Ramalan: adalah mungkin untuk menetapkan kedudukan membeli di atas paras tinggi corak 1.1069, dengan prospek pergerakan seterusnya menjadi unjuran
Carta masa M5 dan M15 mungkin mempunyai lebih banyak titik kemasukan palsu.
Open chart in a new window