

signal strength 3 of 5
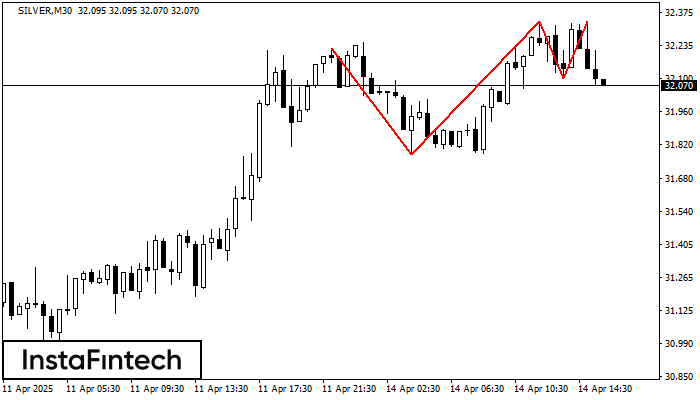
The Triple Top pattern has formed on the chart of the SILVER M30. Features of the pattern: borders have an ascending angle; the lower line of the pattern has the coordinates 31.78/32.10 with the upper limit 32.23/32.34; the projection of the width is 445 points. The formation of the Triple Top figure most likely indicates a change in the trend from upward to downward. This means that in the event of a breakdown of the support level of 31.78, the price is most likely to continue the downward movement.
- All
- Double Top
- Flag
- Head and Shoulders
- Pennant
- Rectangle
- Triangle
- Triple top
- All
- #AAPL
- #AMZN
- #Bitcoin
- #EBAY
- #FB
- #GOOG
- #INTC
- #KO
- #MA
- #MCD
- #MSFT
- #NTDOY
- #PEP
- #TSLA
- #TWTR
- AUDCAD
- AUDCHF
- AUDJPY
- AUDUSD
- EURCAD
- EURCHF
- EURGBP
- EURJPY
- EURNZD
- EURRUB
- EURUSD
- GBPAUD
- GBPCHF
- GBPJPY
- GBPUSD
- GOLD
- NZDCAD
- NZDCHF
- NZDJPY
- NZDUSD
- SILVER
- USDCAD
- USDCHF
- USDJPY
- USDRUB
- All
- M5
- M15
- M30
- H1
- D1
- All
- Buy
- Sale
- All
- 1
- 2
- 3
- 4
- 5
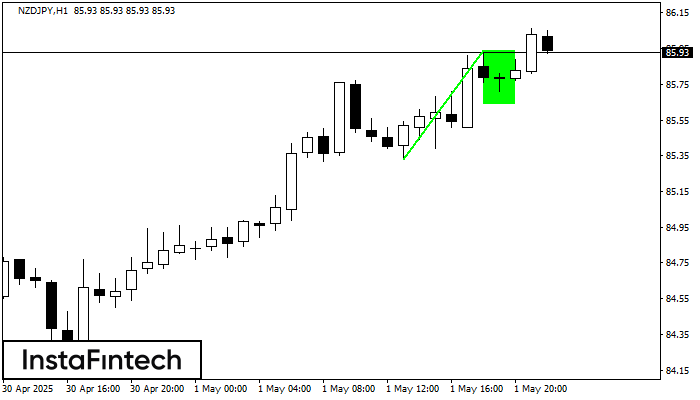
Corak Flag Aliran Menaik yang menandakan kesinambungan aliran telah dibentuk pada carta NZDJPY H1. Ramalan: sekiranya harga menembusi di atas corak yang tinggi pada 85.94, maka pedagang akan dapat membuat
Open chart in a new window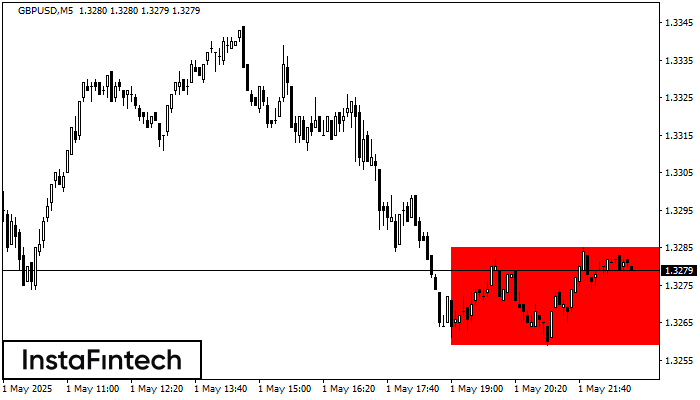
Berdasarkan carta M5, GBPUSD telah membentuk Segi Empat Menurun. Jenis corak ini menunjukkan kesinambungan aliran. Ia terdiri daripada dua tahap: rintangan 1.3285 - 0.0000 dan sokongan 1.3259 – 1.3259. Sekiranya
Carta masa M5 dan M15 mungkin mempunyai lebih banyak titik kemasukan palsu.
Open chart in a new window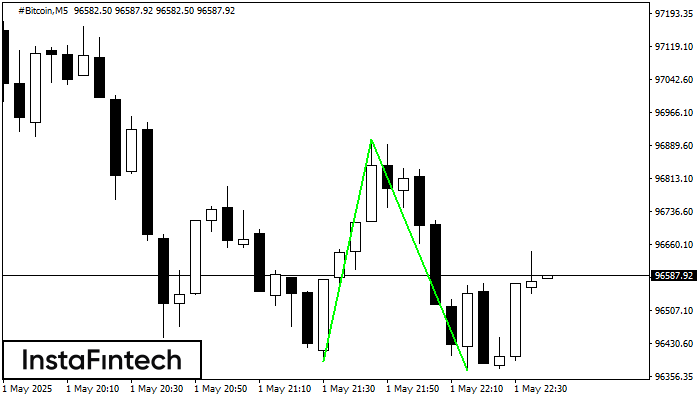
Corak Double Bottom telah dibentuk pada #Bitcoin M5. Pembentukan ini menandakan pembalikan aliran dari aliran menurun ke atas. Isyarat ialah perdagangan membeli harus dibuka selepas sempadan atas corak 96903.54 telah
Carta masa M5 dan M15 mungkin mempunyai lebih banyak titik kemasukan palsu.
Open chart in a new window


