EUR/USD 5-Minute Analysis
On Monday, the EUR/USD currency pair was caught in a storm. It's not particularly useful to analyze the macroeconomic reports released that day, as they had little impact on price movements. The primary driver of the market turbulence was once again U.S. President Donald Trump, with the situation starting as early as Sunday. Over the weekend, it was announced that Trump would impose import tariffs on goods from Mexico, Canada, and China. This news was widely covered and triggered wild fluctuations and a market gap on Monday. By the evening, it was also revealed that tariffs against Mexico had been postponed for a month, and we might see similar announcements regarding China and Canada soon.
Among the macroeconomic reports, the ISM Manufacturing PMI is worth mentioning since it exceeded forecasts. This typically would suggest that the dollar should strengthen during the U.S. trading session. However, that did not occur because the dollar had already risen by 140 pips overnight, despite a lack of objective reasons for such a move. While Trump's tariffs were announced, it's perplexing why they were interpreted as a positive sign for the U.S. economy and its currency. Overall, we witnessed irrational market behavior that disrupted the technical picture.
Discussing Monday's trading signals doesn't yield much value either, particularly since there were no substantial signals formed. The pair fluctuated wildly throughout the day, disregarding technical levels entirely. Even if good signals had been generated, they could have been leveraged for trading, but unfortunately, there were none.
COT Report
The latest COT report is dated January 28. The chart clearly shows that the net position of non-commercial traders remained bullish for an extended period; however, bears have now gained the upper hand. Two months ago, professional traders sharply increased the number of short positions, causing the net position to turn negative for the first time in a long time. This shift indicates that the euro is being sold more frequently than it is being bought.
Currently, there are no fundamental factors supporting the euro's strength. The recent upward movement of the euro on the weekly timeframe is barely noticeable and can be seen as just a simple pullback. While the pair may correct for a few more weeks, this does not change the 16-year downtrend.
At present, the red and blue lines have crossed and changed their relative positions, indicating a bearish trend in the market. Over the last reporting week, the number of long positions in the non-commercial group decreased by 14,000, while short positions fell by 9,900. As a result, the net position decreased by another 4,100 contracts.
EUR/USD 1-Hour Analysis
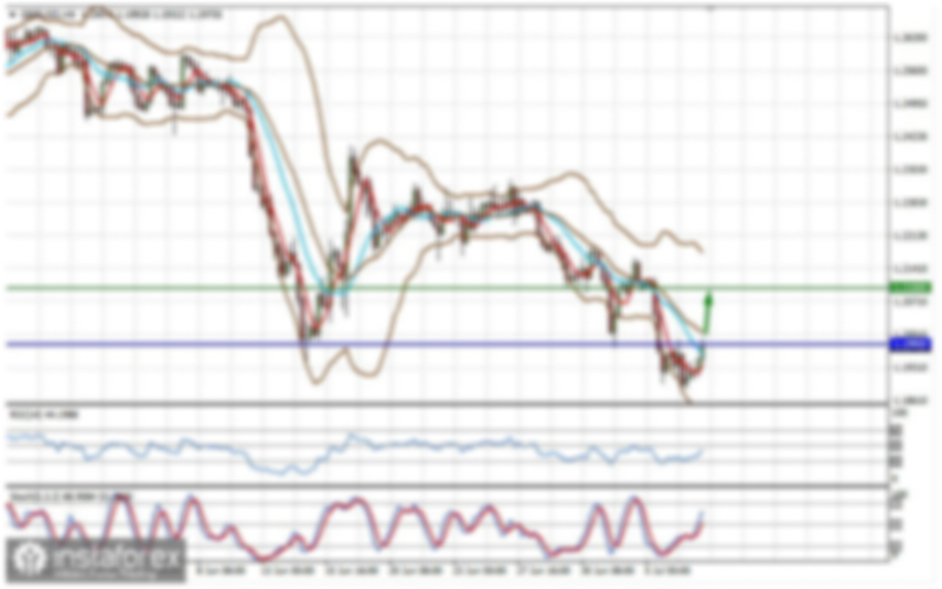
On the hourly timeframe, the currency pair has completed its local uptrend, and a new descending trendline has formed. We anticipate that the decline will continue in the medium term. The Federal Reserve may only lower rates 1-2 times in 2025, which indicates a more hawkish stance than the market had expected. Additionally, following Trump's tariffs, inflation in the U.S. could rise sharply, prompting an even more hawkish approach from the Fed throughout the year. The price remains below the Ichimoku indicator lines, suggesting that further declines in the euro are likely.
For February 4, we highlight the following trading levels: 1.0124, 1.0195, 1.0269, 1.0340-1.0366, 1.0461, 1.0524, 1.0585, 1.0658-1.0669, 1.0757, 1.0797, and 1.0843. Also noteworthy are the Senkou Span B line at 1.0397 and the Kijun-sen line at 1.0340. Please note that the Ichimoku indicator lines may shift throughout the day, which should be taken into account when identifying trading signals. Remember to set your Stop Loss to breakeven if the price moves 15 pips in your favor. This will help protect against potential losses if the signal turns out to be false.
On Tuesday, there are no significant events scheduled in the Eurozone; however, the U.S. will be releasing the ADP report on private-sector employment. The market will likely still be reacting to the events from Monday, so be prepared for another day of volatility and irrational movements.
Illustration Explanations:
- Support and Resistance Levels (thick red lines): Thick red lines indicate where movement may come to an end. Please note that these lines are not sources of trading signals.
- Kijun-sen and Senkou Span B Lines: Ichimoku indicator lines transferred from the 4-hour timeframe to the hourly timeframe. These are strong lines.
- Extreme Levels (thin red lines): Thin red lines where the price has previously bounced. These serve as sources of trading signals.
- Yellow Lines: Trendlines, trend channels, or any other technical patterns.
- Indicator 1 on COT Charts: Represents the net position size for each category of traders.