empty
05.03.2025 08:23 PM
EUR/USD Analysis – March 5th

This image is no longer relevant

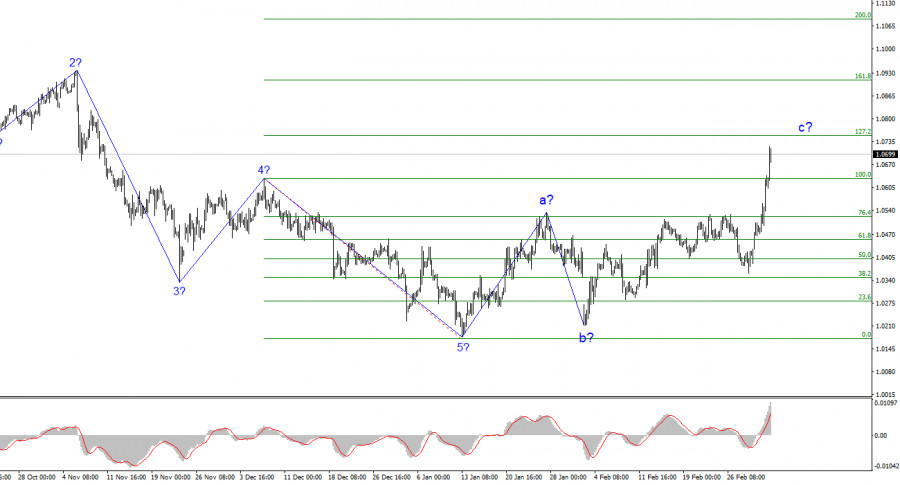
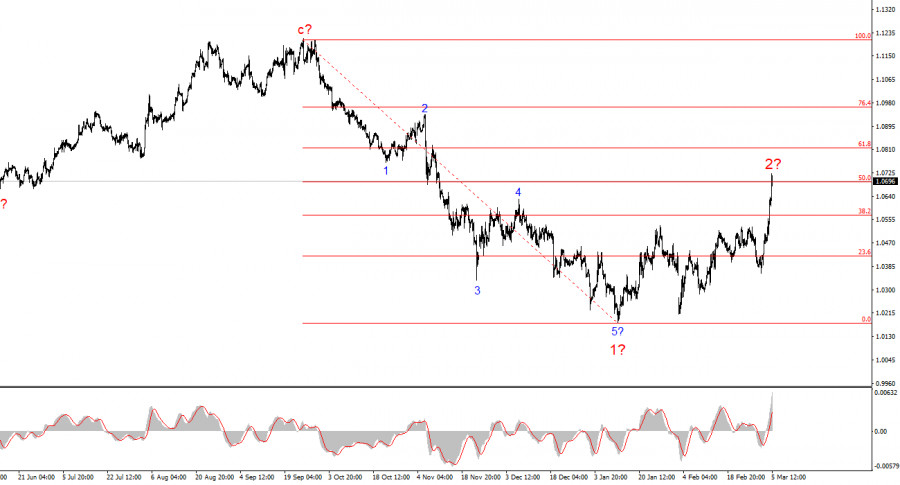
The wave pattern on the 4-hour EUR/USD chart appears clear and structured. A new downward cycle began on September 25, forming a five-wave impulse structure. Two months ago, a corrective upward movement started, expected to consist of at least three waves. The structure of the first wave was well-defined, suggesting that the second wave will also take a clear shape. Three waves have already formed, but a fifth wave (e) might still develop, or wave (c) in wave 2 could take on a full five-wave pattern.

Overall, the current wave count does not raise concerns about ambiguity. The fundamental background continues to favor sellers over buyers, especially when considering economic data. Recent U.S. reports consistently indicate a strong economy with no signs of significant slowdown. The Federal Reserve will proceed with policy easing at a cautious pace, whereas the European Central Bank sees no reason to pause its rate-cutting cycle. This suggests that, in the long run, the U.S. dollar should remain in demand. However, the current correction phase is ongoing, with the market reducing demand for the dollar due to Trump's policies.

The EUR/USD rate surged by 135 basis points on Tuesday and added another 80 points today. The reasons behind this rapid market shift away from the U.S. dollar are not difficult to identify. Since Friday, I have warned that the market was heading into a new Trump-driven storm. Like many others, I did not anticipate such a drastic depreciation of the U.S. dollar, which lost three cents in under three trading days. However, for Donald Trump, nothing seems impossible. Under his leadership, the U.S. economy is slowing down, facing a potential recession, stock markets are falling, and the dollar is depreciating.

Trump may have a long-term strategy in place, aiming to weaken the dollar and increase import revenues. Maintaining friendly relations with Canada and Mexico does not appear to be a priority for him. Whether this strategy will prove successful remains to be seen in the coming weeks. The next four years promise to be eventful and unpredictable.

On Wednesday, the Eurozone released new reports on services sector activity for February. The final figures were weaker than market expectations, yet they had no impact on the euro's ability to rise. The market ignored economic data on Wednesday, much like it did on Monday and Tuesday, despite some reports being supportive of euro buyers. However, economic indicators were not the primary driver behind the EUR/USD rally.

This image is no longer relevant

Key Conclusions

Based on the EUR/USD analysis, it is evident that the pair continues to develop a downward trend. The first wave of this trend looks complete and well-defined. As a result, a three-wave or more complex correction should be expected, providing new entry opportunities for selling. Since wave 2 has taken on a relatively clear structure, I anticipate a decline within wave 3, potentially targeting 1.03.

A failed breakout at 1.0731, which corresponds to the 161.8% Fibonacci extension of wave b, could indicate a temporary pause in dollar weakening.

On the higher wave scale, the wave pattern has transformed into an impulse structure, suggesting that a new long-term bearish trend may be emerging. However, its length and structure are still difficult to determine at this stage.

Core Principles of My Analysis

  1. Wave structures must be simple and understandable. Complex formations are hard to trade and are prone to frequent changes.
  2. If there is no confidence in the market's direction, it is better to stay out.
  3. There is never 100% certainty in price movement. Always use Stop Loss orders to protect against unexpected reversals.

Wave analysis can be effectively combined with other analytical methods and trading strategies for a more comprehensive market approach.

Chin Zhao,
انسٹافاریکس کا تجزیاتی ماہر
© 2007-2025
Summary
Urgency
Analytic
Alexander Dneprovskiy
Start trade
انسٹافاریکس کے ساتھ کرپٹو کرنسی کی معاملاتی تبدیلیوں سے کمائیں۔
میٹا ٹریڈر 4 ڈاؤن لوڈ کریں اور اپنی پہلی ٹریڈ کھولیں۔
  • Grand Choice
    Contest by
    InstaForex
    InstaForex always strives to help you
    fulfill your biggest dreams.
    مقابلہ میں شامل ہوں

تجویز کردہ مضامین

جولائی 29 کو یورو / یو ایس ڈی: بلز مارکیٹ کو 1.189 کی سطح کی طرف دھکیل سکتے ہیں

طویل مدت میں، یورو / یو ایس ڈی مارکیٹ ایک بڑی تیزی کی اصلاح (بی) تشکیل دے رہی ہے، جو معیاری اے بی سی زگ زیگ کی شکل اختیار

Roman Onegin 19:06 2025-07-29 UTC+2

یورو / یو ایس ڈی کا تجزیہ برائے 17 جولائی 2025

یورو / یو ایس ڈی کے لیے 4 گھنٹے کے چارٹ پر لہر کا پیٹرن مسلسل کئی مہینوں سے غیر تبدیل شدہ ہے۔ اوپر کی طرف رجحان والے

Chin Zhao 21:57 2025-07-16 UTC+2

جولائی 16 2025 کو جی بی پی / یو ایس ڈی تجزیہ

جی بی پی / یو ایس ڈی کے لیے لہر کا پیٹرن بلش امپلس ویو پیٹرن کی تشکیل کی نشاندہی کرتا ہے۔ لہر کی ترتیب تقریباً یورو

Chin Zhao 21:53 2025-07-16 UTC+2

یورو / یو ایس ڈی کا تجزیہ برائے 30 جون 2025

یورو / یو ایس ڈی کے لیے 4 گھنٹے کے چارٹ پر لہر کا پیٹرن اوپر کی طرف رجحان والے حصے کی تشکیل کی نشاندہی کرتا ہے۔ 28 فروری تک،

Chin Zhao 20:17 2025-06-30 UTC+2

جی بی پی / یو ایس ڈی : تجزیہ اور پیشن گوئی

جی بی پی / یو ایس ڈی کے لیے لہر کا پیٹرن اوپر کی طرف آنے والی لہر کے پیٹرن کی تشکیل کی تجویز کرتا ہے۔ لہر کی تصویر تقریباً

Chin Zhao 20:14 2025-06-30 UTC+2

یورو / یو ایس ڈی کا تجزیہ برائے 23 جون 2025

یہ کہ 4 گھنٹے کے یورو / یو ایس ڈی چارٹ کا لہر پیٹرن اوپر کی طرف رجحان والے حصے کی ترقی کی نشاندہی کرتا ہے۔ یہ تبدیلی

Chin Zhao 19:35 2025-06-23 UTC+2

یورو / یو ایس ڈی کا تجزیہ برائے 18 جون 2025

یورو / یو ایس ڈی پئیر کے 4 گھنٹے کے چارٹ پر لہر کا پیٹرن تیزی کے رجحان والے حصے کی تشکیل کی نشاندہی کرتا ہے۔ یہ تبدیلی مکمل

Chin Zhao 20:02 2025-06-18 UTC+2

جون 16 2025 کو یورو / یو ایس ڈی تجزیہ

چار گھنٹے کے یورو / یو ایس ڈی چارٹ پر لہر کا پیٹرن اوپر کی طرف رجحان والے حصے کی ترقی کی نشاندہی کرتا ہے۔ یہ تبدیلی

Chin Zhao 20:07 2025-06-16 UTC+2

جون 16 2025 کو جی بی پی/ یو ایس ڈی تجزیہ

جی بی پی/یو ایس ڈی کے لیے ویوو پیٹرن میں اوپر کی طرف امپلس رجحان کی ترقی جاری ہے۔ ویوو پیٹرن تقریباً یورو/امریکی ڈالر کی طرح ہی ہے، کیونکہ

Chin Zhao 19:58 2025-06-16 UTC+2

جی بی پی / یو ایس ڈی کا تجزیہ برائے 04 جون 2025

بدھ کو جی بی پی / یو ایس ڈی کی شرح مبادلہ میں 25 بنیادی پوائنٹس کا اضافہ ہوا لیکن آج اور ہفتے کے آخر تک بہت زیادہ چڑھ سکتا

Chin Zhao 21:31 2025-06-04 UTC+2
ابھی فوری بات نہیں کرسکتے ؟
اپنا سوال پوچھیں بذریعہ چیٹ.
Widget callback
 

Dear visitor,

Your IP address shows that you are currently located in the USA. If you are a resident of the United States, you are prohibited from using the services of InstaFintech Group including online trading, online transfers, deposit/withdrawal of funds, etc.

If you think you are seeing this message by mistake and your location is not the US, kindly proceed to the website. Otherwise, you must leave the website in order to comply with government restrictions.

Why does your IP address show your location as the USA?

  • - you are using a VPN provided by a hosting company based in the United States;
  • - your IP does not have proper WHOIS records;
  • - an error occurred in the WHOIS geolocation database.

Please confirm whether you are a US resident or not by clicking the relevant button below. If you choose the wrong option, being a US resident, you will not be able to open an account with InstaForex anyway.

We are sorry for any inconvenience caused by this message.