empty
31.03.2025 09:07 AM
EUR/USD and GBP/USD March 31 – Technical Analysis

EUR/USD

This image is no longer relevant

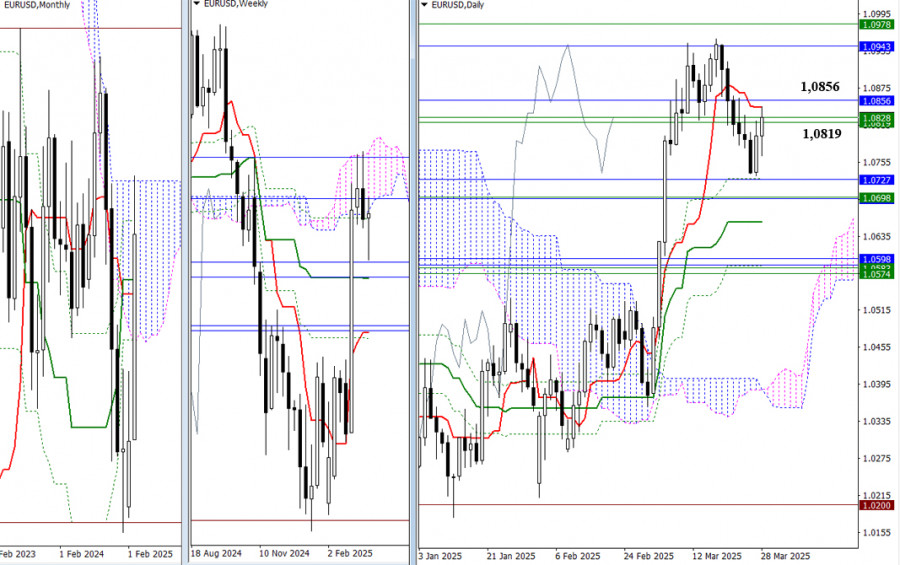
During the week, bearish players attempted to confirm the earlier-formed pullback and continue the decline but were unsuccessful, resulting in a long lower shadow on the weekly candlestick. The pair has returned to the cluster of resistance levels (1.0819–1.0856), which now represents the nearest resistance zone. Under the current conditions, a new phase of consolidation and uncertainty is possible. A firm consolidation above 1.0844–1.0856 would give buyers another opportunity to test the upper boundaries of the weekly (1.0978) and monthly (1.0943) Ichimoku clouds, aiming to break through and enter the bullish zone in terms of Ichimoku cloud analysis. If the current resistances are not broken and bearish players return to the market, the nearest downside targets in this part of the chart are around 1.0698–1.0727 and 1.0574–1.0598.

This image is no longer relevant

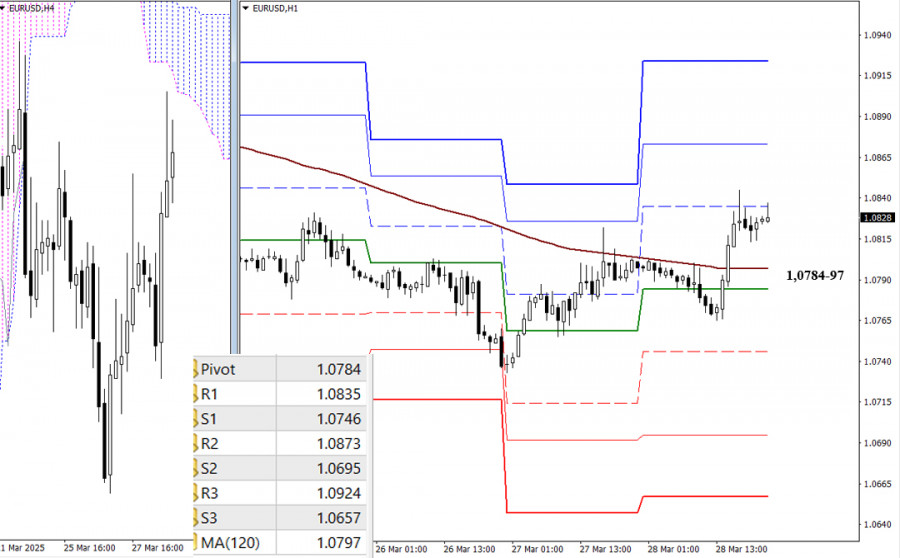
The main advantage currently lies with the bulls on the lower timeframes. If they reverse the weekly long-term trend (1.0797) and continue the upward movement, intraday reference points will be the resistances of the classic Pivot levels. Losing the key levels of 1.0784–1.0797 would affect the current balance of power, and increased bearish sentiment on the lower timeframes would develop through the breakdown of classic Pivot supports. Updated Pivot values will appear when the market opens.

***

GBP/USD

This image is no longer relevant

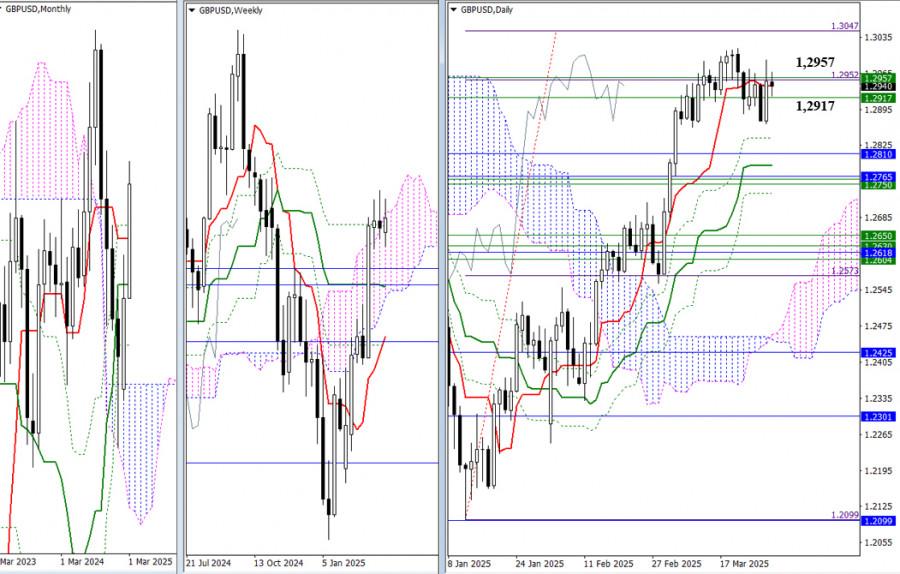
For the third consecutive week, the pound has been unable to exit the zone of uncertainty formed by the convergence of two weekly resistance levels (1.2917–1.2957) and the fulfillment of the daily target to break through the Ichimoku cloud at the first target level (1.2952). As a result, the situation has not significantly changed, and the following reference levels remain in place. For bulls, the nearest goal remains the daily target at 1.3047. Bears, meanwhile, still face a wide support zone that combines levels from multiple timeframes, headed by the monthly short-term trend (1.2765), the weekly medium-term trend (1.2761), and the daily medium-term trend (1.2786).

This image is no longer relevant

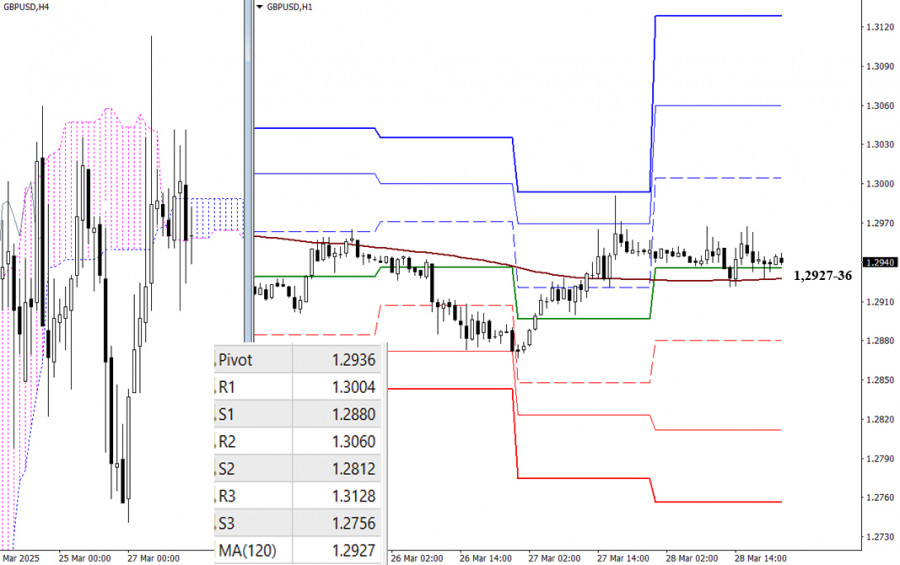
The uncertainty of the higher timeframes is also reflected in the lower timeframes. The pair has been hovering near the key levels of 1.2927–1.2936 (weekly long-term trend + daily central Pivot level) for an extended period. A restraining factor in this area is the influence of the H4 Ichimoku cloud, which is currently positioned almost horizontally. If a directional move forms, intraday reference points will be the support and resistance levels of the classic Pivot Points. New values for these Pivot levels will appear when the market opens.

***

Technical Analysis Components:
  • Higher Timeframes: Ichimoku Kinko Hyo (9.26.52) and Fibonacci Kijun levels
  • H1: Classic Pivot Points and 120-period Moving Average (weekly long-term trend)
Evangelos Poulakis,
انسٹافاریکس کا تجزیاتی ماہر
© 2007-2025
Summary
Urgency
Analytic
Zhizhko Nadezhda
Start trade
انسٹافاریکس کے ساتھ کرپٹو کرنسی کی معاملاتی تبدیلیوں سے کمائیں۔
میٹا ٹریڈر 4 ڈاؤن لوڈ کریں اور اپنی پہلی ٹریڈ کھولیں۔
  • Grand Choice
    Contest by
    InstaForex
    InstaForex always strives to help you
    fulfill your biggest dreams.
    مقابلہ میں شامل ہوں

تجویز کردہ مضامین

جولائی 24 2025 کو یورو / یو ایس ڈی کے لیے پیشن گوئی

بدھ کو، یورو / یو ایس ڈی جوڑا 127.2% فیبوناچی ریٹریسمنٹ کی سطح سے 1.1712 پر واپس آیا، یورو کے حق میں پلٹ گیا، اور 1.1802

Samir Klishi 19:30 2025-07-24 UTC+2

جی بی پی / یو ایس ڈی کی پیشن گوئی برائے 24 جولائی 2025

فی گھنٹہ چارٹ پر، جی بی پی / یو ایس ڈی جوڑا بدھ کو 1.3530 پر 61.8% فیبوناچی ریٹریسمنٹ کی سطح سے اوپر مضبوط ہوا اور 1.3579 پر 50.0%

Samir Klishi 19:17 2025-07-24 UTC+2

جولائی 23-26 2025 کے لیے بٹ کوائن کے لیے تجارتی اشارہ: $118,000 سے اوپر خریدیں (21 ایس ایم اے - 6/8 مرے)

اگر بٹ کوائن میں اضافہ جاری رہتا ہے، تو ہم یہ توقع کر سکتے ہیں کہ یہ 121,875 پر 7/8 مرے کی سطح تک پہنچ جائے گا اور بالآخر $125,000

Dimitrios Zappas 16:59 2025-07-23 UTC+2

جولائی 23-26 2024 کے لیے سونے (ایکس اے یو / یو ایس ڈی) کے لیے تجارتی سگنل: $3,437 سے نیچے فروخت (21 ایس ایم اے - 8/8 مرے)

اگر یہ 3,437 سے اوپر مستحکم ہوتا ہے تو ہمارے پاس سونے کے لئے مثبت نقطہ نظر ہوسکتا ہے۔ پھر، یہ 3,472 پر +1/8 مرے تک پہنچ سکتا

Dimitrios Zappas 16:55 2025-07-23 UTC+2

یو ایس ڈی / سی اے ڈی تجزیہ اور پیشن گوئی

یو ایس ڈی / سی اے ڈی پئیر فی الحال 1.3600 کی نفسیاتی سطح سے نیچے ایک تنگ تجارتی رینج کے اندر اتار چڑھاؤ کے ساتھ بیئرش کنسولیڈیشن کے مرحلے

Irina Yanina 15:50 2025-07-23 UTC+2

یو ایس ڈی / سی اے ڈی : تجزیہ اور پیشن گوئی

آج کے یوروپی سیشن کے اوائل میں، یورو / یو ایس ڈی جوڑے نے اپنی کمی کو روکنے کی کوشش کی لیکن ناکام رہا۔ یہ فی الحال 1.3678

Irina Yanina 20:40 2025-07-22 UTC+2

جولائی 22-25 2025 کے لیے سونے (ایکس اے یو / یو ایس ڈی) کے لیے تجارتی اشارہ : $3,380 سے اوپر خریدیں اور $3,370 سے نیچے فروخت کریں (200 ای ایم اے - 7/8 مرے)

ایگل انڈیکیٹر اوور بوٹ زون تک پہنچ گیا ہے، اس لیے ہمیں یقین ہے کہ آنے والے دنوں میں سونے میں مضبوط تکنیکی اصلاح ہو سکتی ہے۔ اگر قیمت 6/8

Dimitrios Zappas 08:27 2025-07-22 UTC+2

بٹ کوائن کے لیے 22-25 جولائی 2025 کے لیے تجارتی اشارہ : $115,625 سے اوپر خریدیں (/8 مرے - 21 ایس ایم اے)

بٹ کوائن $117,522 کے قریب ٹریڈ کر رہا ہے، جو $116,070 کی کم ترین سطح پر پہنچنے کے بعد واپس اچھال رہا ہے۔ کل، یوروپی سیشن کے دوران، بٹ کوائن

Dimitrios Zappas 08:23 2025-07-22 UTC+2

جولائی 22-25 2025 کے لیے یورو / یو ایس ڈی کے لیے تجارتی سگنل: 1.1718 سے نیچے فروخت کریں (200 ای ایم اے - 8/8 مرے)

یورپی سیشن کے آغاز میں، یورو 1.1689 کے ارد گرد ٹریڈ کر رہا ہے، 1.1540 کے ارد گرد ڈاؤن ٹرینڈ چینل کے نیچے تک پہنچنے کے بعد کچھ بحالی دکھا

Dimitrios Zappas 08:17 2025-07-22 UTC+2

یورو / یو ایس ڈی: تجزیہ اور پیشن گوئی

نئے ہفتے کے آغاز پر، یورو / یو ایس ڈی جوڑا ایک معتدل رینج میں رہتا ہے اور ایک تنگ چینل میں تجارت کرتا ہے۔ فی الحال، کوٹس 1.1650

Irina Yanina 17:42 2025-07-21 UTC+2
ابھی فوری بات نہیں کرسکتے ؟
اپنا سوال پوچھیں بذریعہ چیٹ.
Widget callback
 

Dear visitor,

Your IP address shows that you are currently located in the USA. If you are a resident of the United States, you are prohibited from using the services of InstaFintech Group including online trading, online transfers, deposit/withdrawal of funds, etc.

If you think you are seeing this message by mistake and your location is not the US, kindly proceed to the website. Otherwise, you must leave the website in order to comply with government restrictions.

Why does your IP address show your location as the USA?

  • - you are using a VPN provided by a hosting company based in the United States;
  • - your IP does not have proper WHOIS records;
  • - an error occurred in the WHOIS geolocation database.

Please confirm whether you are a US resident or not by clicking the relevant button below. If you choose the wrong option, being a US resident, you will not be able to open an account with InstaForex anyway.

We are sorry for any inconvenience caused by this message.