اصل پیٹرن یعنی ایکچوئل پیٹرن
پیٹرن تصویری صورت یعنی گرافکل ماڈلز ہوتے ہیں جو کہ چارٹ میں قیمت کی جانب سے بنتے ہیں جو کہ ٹیکنیکل تجزیات کے امکانات ، ہسٹری {قیمت کے اتار چڑھاو} چونکہ قیمت اپنے آپ کو دہراتی ہے - جس کا مطلب یہ ہے کہ قیمت کا اتار چڑھا یعنی حرکت ایک جیسے حالات میں ہی عموما مختلف ہوتی ہے جو کہ اس بات کو ممکن بناتی ہے قیمت کے مزید رویہ کی پیشن گوئی کی جاسکے جس کا اُسی طرح ہونے کے امکانات خاصے واضح ہوتے ہیں
Actual Patterns
- All
- Double Top
- Flag
- Head and Shoulders
- Pennant
- Rectangle
- Triangle
- Triple top
- All
- #AAPL
- #AMZN
- #Bitcoin
- #EBAY
- #FB
- #GOOG
- #INTC
- #KO
- #MA
- #MCD
- #MSFT
- #NTDOY
- #PEP
- #TSLA
- #TWTR
- AUDCAD
- AUDCHF
- AUDJPY
- AUDUSD
- EURCAD
- EURCHF
- EURGBP
- EURJPY
- EURNZD
- EURRUB
- EURUSD
- GBPAUD
- GBPCHF
- GBPJPY
- GBPUSD
- GOLD
- NZDCAD
- NZDCHF
- NZDJPY
- NZDUSD
- SILVER
- USDCAD
- USDCHF
- USDJPY
- USDRUB
- All
- M5
- M15
- M30
- H1
- D1
- All
- Buy
- Sale
- All
- 1
- 2
- 3
- 4
- 5

The Double Top pattern has been formed on GBPUSD M5. It signals that the trend has been changed from upwards to downwards. Probably, if the base of the pattern 1.3238
The M5 and M15 time frames may have more false entry points.
Open chart in a new window
The GBPAUD M5 formed the Head and Shoulders pattern with the following features: The Head’s top is at 2.0878, the Neckline and the upward angle are at 2.0820/2.0825. The formation
The M5 and M15 time frames may have more false entry points.
Open chart in a new window
According to the chart of M5, GOLD formed the Bearish Rectangle which is a pattern of a trend continuation. The pattern is contained within the following borders: lower border 3312.24
The M5 and M15 time frames may have more false entry points.
Open chart in a new window
The Double Bottom pattern has been formed on NZDCAD M30. Characteristics: the support level 0.8188; the resistance level 0.8232; the width of the pattern 44 points. If the resistance level
Open chart in a new window
The Bullish Flag pattern has been formed on NZDCHF at M5. The lower boundary of the pattern is located at 0.4839/0.4829, while the higher boundary lies at 0.4849/0.4839. The projection
The M5 and M15 time frames may have more false entry points.
Open chart in a new window
The Bullish pennant signal – Trading instrument NZDCHF M5, continuation pattern. Forecast: it is possible to set up a buy position above the pattern’s high of 0.4849, with the prospect
The M5 and M15 time frames may have more false entry points.
Open chart in a new window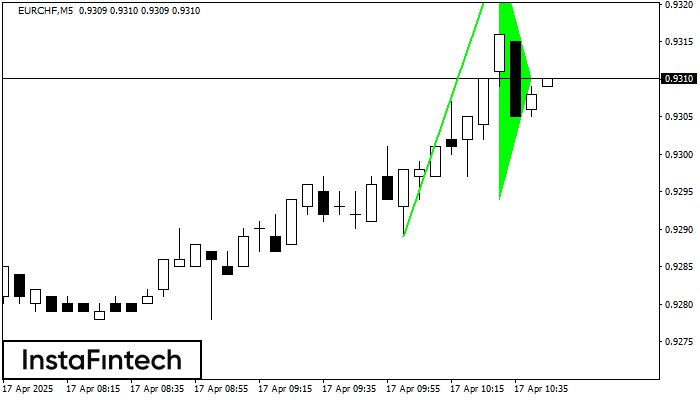
The Bullish pennant pattern is formed on the EURCHF M5 chart. It is a type of the continuation pattern. Supposedly, in case the price is fixed above the pennant’s high
The M5 and M15 time frames may have more false entry points.
Open chart in a new window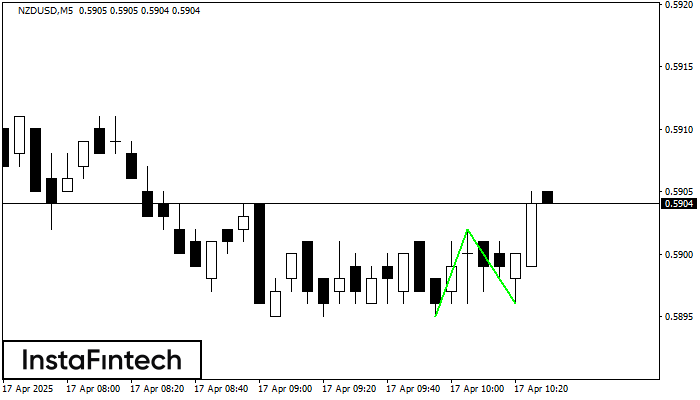
The Double Bottom pattern has been formed on NZDUSD M5; the upper boundary is 0.5902; the lower boundary is 0.5896. The width of the pattern is 7 points. In case
The M5 and M15 time frames may have more false entry points.
Open chart in a new window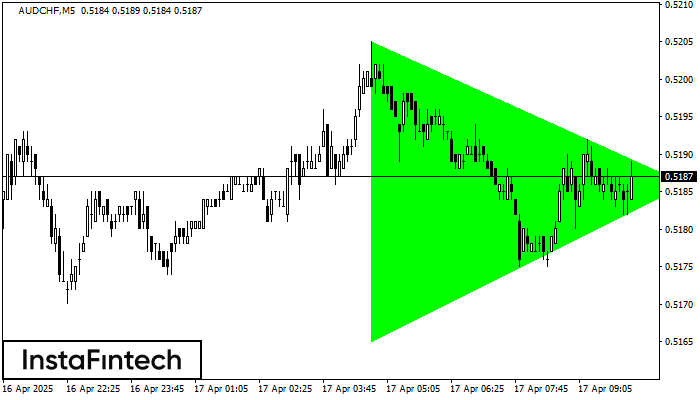
According to the chart of M5, AUDCHF formed the Bullish Symmetrical Triangle pattern. The lower border of the pattern touches the coordinates 0.5165/0.5186 whereas the upper border goes across 0.5205/0.5186
The M5 and M15 time frames may have more false entry points.
Open chart in a new window