сила сигнала 1 из 5
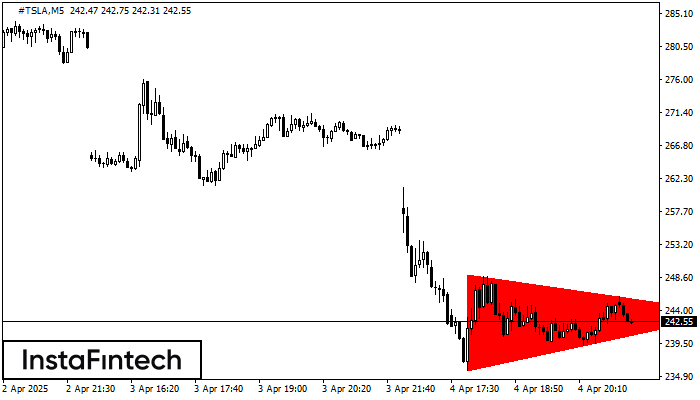
На графике #TSLA M5 сформировалась фигура «Медвежий симметричный треугольник». Характеристика фигуры: Нижняя граница 235.81/243.68; Верхняя граница 249.04/243.68; Проекция ширины фигуры -1323 пунктов. Формирование фигуры «Медвежий симметричный треугольник» наиболее вероятным образом свидетельствует о продолжении нисходящего тренда. Это означает, что курс #TSLA, в случае срабатывания фигуры, пробьет нижнюю границу и, вероятно, проследует к 243.53.
Таймфреймы М5 и М15 могут иметь больше ложных точек входа.
- Все
- Вымпел
- Голова и плечи
- Двойная вершина
- Прямоугольник
- Треугольник
- Тройная вершина
- Флаг
- Все
- #AAPL
- #AMZN
- #Bitcoin
- #EBAY
- #FB
- #GOOG
- #INTC
- #KO
- #MA
- #MCD
- #MSFT
- #NTDOY
- #PEP
- #TSLA
- #TWTR
- AUDCAD
- AUDCHF
- AUDJPY
- AUDUSD
- EURCAD
- EURCHF
- EURGBP
- EURJPY
- EURNZD
- EURRUB
- EURUSD
- GBPAUD
- GBPCHF
- GBPJPY
- GBPUSD
- GOLD
- NZDCAD
- NZDCHF
- NZDJPY
- NZDUSD
- SILVER
- USDCAD
- USDCHF
- USDJPY
- USDRUB
- Все
- M5
- M15
- M30
- H1
- D1
- Все
- Покупка
- Продажа
- Все
- 1
- 2
- 3
- 4
- 5
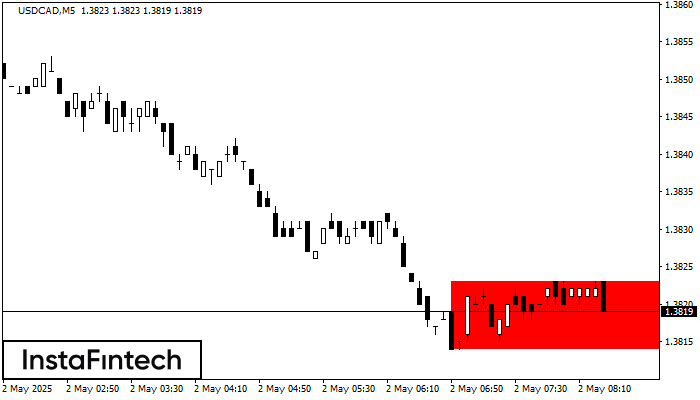
According to the chart of M5, USDCAD formed the Bearish Rectangle which is a pattern of a trend continuation. The pattern is contained within the following borders: lower border 1.3814
The M5 and M15 time frames may have more false entry points.
Open chart in a new window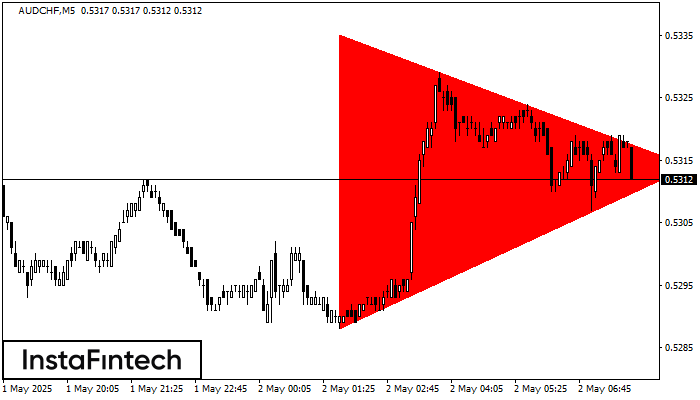
According to the chart of M5, AUDCHF formed the Bearish Symmetrical Triangle pattern. Trading recommendations: A breach of the lower border 0.5288 is likely to encourage a continuation
The M5 and M15 time frames may have more false entry points.
Open chart in a new window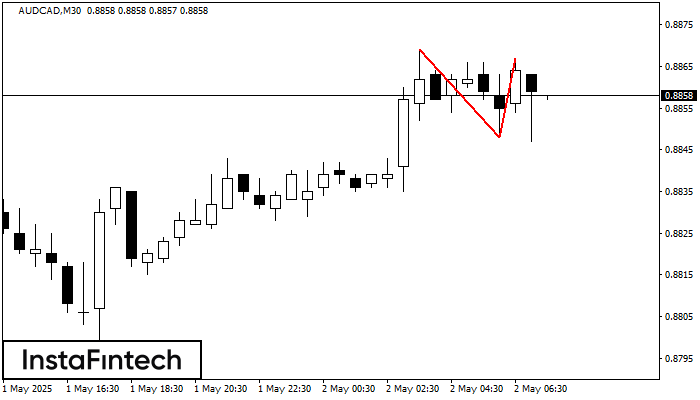
The Double Top pattern has been formed on AUDCAD M30. It signals that the trend has been changed from upwards to downwards. Probably, if the base of the pattern 0.8848
Open chart in a new window