signal strength 2 of 5
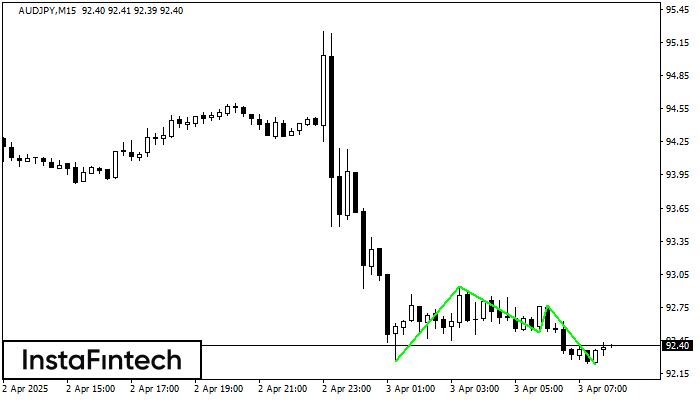
The Triple Bottom pattern has been formed on AUDJPY M15. It has the following characteristics: resistance level 92.94/92.77; support level 92.26/92.23; the width is 68 points. In the event of a breakdown of the resistance level of 92.94, the price is likely to continue an upward movement at least to 92.75.
The M5 and M15 time frames may have more false entry points.
Xem thêm
- All
- Double Top
- Flag
- Head and Shoulders
- Pennant
- Rectangle
- Triangle
- Triple top
- All
- #AAPL
- #AMZN
- #Bitcoin
- #EBAY
- #FB
- #GOOG
- #INTC
- #KO
- #MA
- #MCD
- #MSFT
- #NTDOY
- #PEP
- #TSLA
- #TWTR
- AUDCAD
- AUDCHF
- AUDJPY
- AUDUSD
- EURCAD
- EURCHF
- EURGBP
- EURJPY
- EURNZD
- EURRUB
- EURUSD
- GBPAUD
- GBPCHF
- GBPJPY
- GBPUSD
- GOLD
- NZDCAD
- NZDCHF
- NZDJPY
- NZDUSD
- SILVER
- USDCAD
- USDCHF
- USDJPY
- USDRUB
- All
- M5
- M15
- M30
- H1
- D1
- All
- Buy
- Sale
- All
- 1
- 2
- 3
- 4
- 5
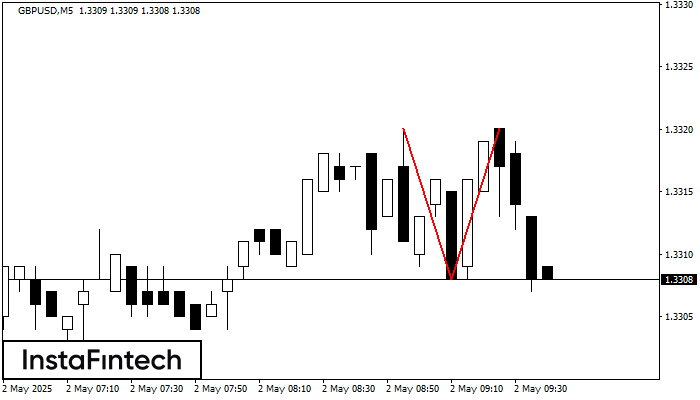
The Double Top reversal pattern has been formed on GBPUSD M5. Characteristics: the upper boundary 1.3320; the lower boundary 1.3308; the width of the pattern is 12 points. Sell trades
The M5 and M15 time frames may have more false entry points.
Open chart in a new window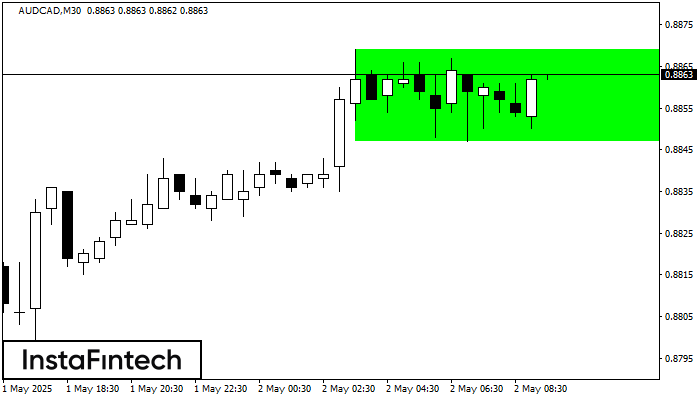
According to the chart of M30, AUDCAD formed the Bullish Rectangle. The pattern indicates a trend continuation. The upper border is 0.8869, the lower border is 0.8847. The signal means
Open chart in a new window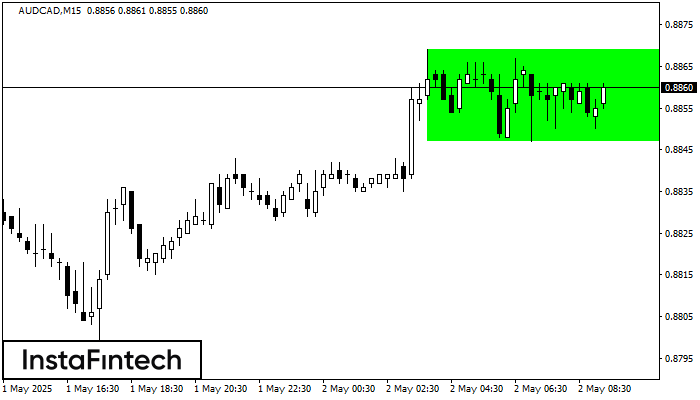
According to the chart of M15, AUDCAD formed the Bullish Rectangle. This type of a pattern indicates a trend continuation. It consists of two levels: resistance 0.8869 and support 0.8847
The M5 and M15 time frames may have more false entry points.
Open chart in a new window